My first post ever on PAAS was late November 2013 in which I suggested a bottom was in or near. The price was $10.34 at that time and the shares pretty much took off from that point to peak at near $16.
In my most recent major high level update of PAAS which occurred back in May of 2014, I warned of potential M+M trouble ahead. While the actual chart turned into a 4th wave triangle which was slightly different than what I modeled, we did head back down to the kinds of levels modeled for the double bottom shown in that chart. I updated that model back in October with this chart and of course the sell signal happened by PAAS being unable to hold the indicated support:
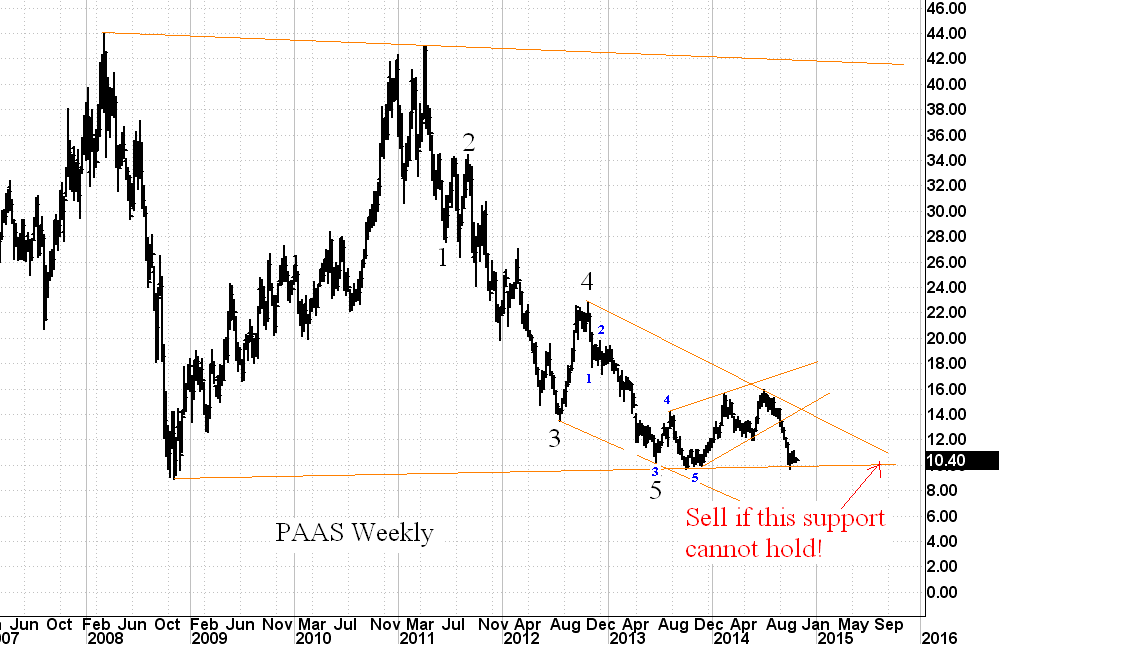
Today's update is below and it indicates that we might already be at a bottom but leaves open the possibility that the sideways chop we are now seeing could be 4 of 5 of 5. The green lines show the potential 4th wave triangle forming. If that path is taken, it will likely appear as the pink model. However, if about $9.75 does not hold as resistance then that 4th wave triangle model will be bust and the red model will be the primary. That could occur as soon as next week since PAAS closed at $9.65 in Friday's extended trading according to Yahoo finance.

This is no man's land as far as picking the exact bottom is concerned but we are getting very, very close if not already there. Again, there is no way to call it exactly until a full and obvious wave count is seen and this is usually not the case near turning points. During 3rd waves when the herd is clear as to which direction it is heading in, the EW patterns are very clear but 5th waves near major turns can and often are confused, tricky choppy messes which is just about how I would describe the PAAS chart.

Folks, this is one you should be telling your mother to buy, at least until it tests $16 (at which time I will update with a count of the waves that got us there). M+M have gotten the living crap beaten out of them so nobody is buying a peak here! We are much closer to a significant bottom than to any kind of top.
This is how you make money in the stock market: buy the bottom when everyone else has given up, everyone else thinks the dollar is unstoppable, everyone else thinks oil is going to zero, OPEC is dead, blah blah blah AND when you have a wave count model that says a bottom is likely. You need both of these (chart and sentiment) in order to have the max chance of catching the big turn.
PAAS is sporting a nice 5% yield even at depressed silver prices. 377mn cash vs 78mn debt puts it into position to weather the storm until metals actually do turn around. Price to sales could be lower at 1.78 but P/B is a seriously cheap 0.66.
Of course, none of those "fundamentals" have saved it from crashing down to the $8.60 level this time around so fundamentals really don't mean jack shit. It's the wave count that makes this a buy IMO and while there remains the potential for a spike down to $8.50 it would be momentary and a huge buy signal, not a sell signal. The time for selling was in the low 40s!


No comments:
Post a Comment