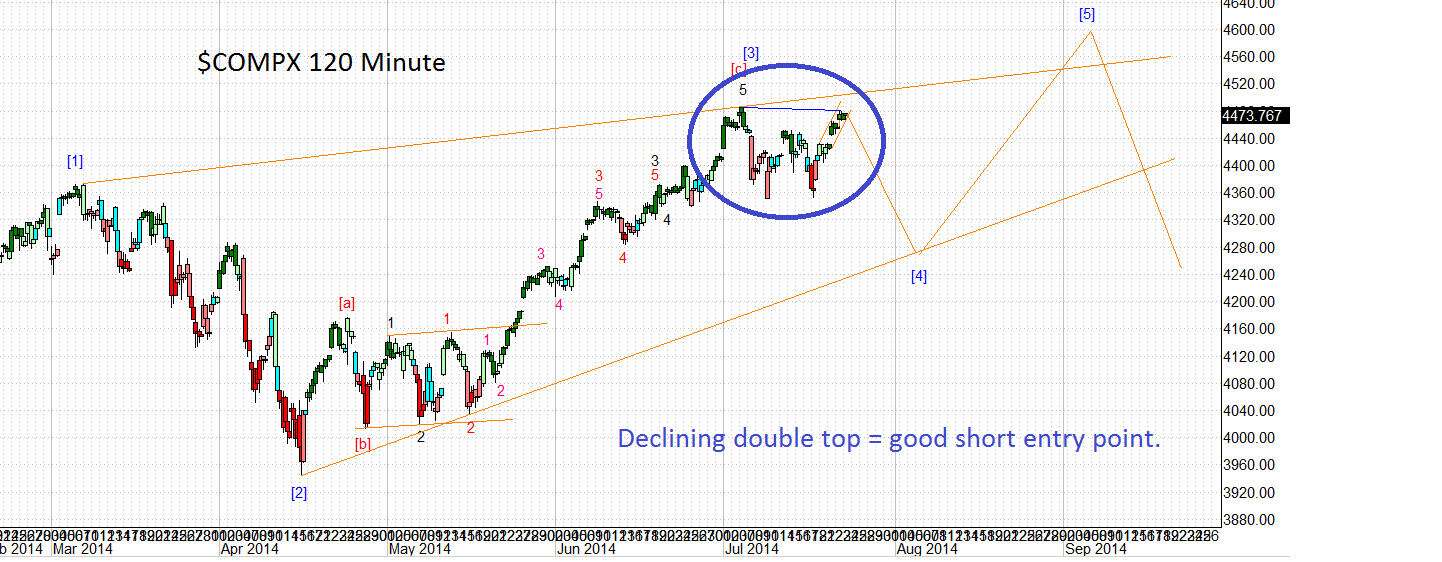
Those models compare nicely in both time frame and price level to the current actual chart which is below. The declining double top circled in blue above was in fact a good short entry point and from [3] to [4] TVIX went from $2.65 to $4.20.
If you are not in TVIX right now, I humbly suggest that you consider a position in it the very second that $COMPX falls below the top. If you do this, set your stops to trigger if it trades back above the top rail again. A break down through the top rail at the red circle is first confirmation. A break through the bottom rail at the blue circle is the second confirmation.

Now let's zoom back out to the weekly model and see what this really means. If this chart breaks down as expected, it will be an ending diagonal in the C wave of the rally since 2009. That could be a 5th but it could also be a 3rd. I will be watching for an a-b-c type of pullback, likely to $COMPX 4000 which would also just happen to be at the level of the prior 4th.
Do you know what TVIX was trading for back then? As in back at the prior 4th of TVIX? Folks, it peaked at almost $12 back then. Today it trades at $2.81. You do the percentage math on that one. Even if it only bounces to the 61.8% fib during the $COMPX fall down to 4k, that is a price target of $8.31 for TVIX which is still a 300% increase from the current price.

Perhaps now you can see why I have been so dogged about following this wounded bird down. In fact, I hope this does turn out to be only 3 of C as my proprietary indicator would lean us towards so that the 4th can pull back to 4000 and the subsequent 5th wave can perhaps form some kind of double top in 2015. I'll definitely dump TVIX and probably swing long for that bounce should we only get an a-b-c pullback to 4k.
But let's not get too far ahead of ourselves, shall we? First the $COMPX has to break down and there are no guarantees that there won't be one more little push up before that happens.
Each of the waves of the rising wedge should be formed by a 3 wave movement (a-b-c) consisting of 5-3-5. Below is my model for this with the $COMPX rising wedge. It is possible that the recent sideways action will turn out to be 4 of C but if that is the case then 5 of c should be no more than about 100 $COMPX points higher than Friday's close. So, perhaps 4666 for the peak of that final wave should it come to that. There are other possibilities as well but they are much lower odds IMO given all of the other technical indicators out there including individual stock charts, market internals, etc.


No comments:
Post a Comment