What I mean to say is that Staples pays yearly dividend of 4.2% with "only" a 51% payout ratio. I would prefer to see that at more like 20% but I've seen much worse. Cash is a respectable 492mn compared to 1.1bn in debt. That is actually not bad at all. Too many companies are 10:1 debt to cash. Price:Book is a very nice 1.29 and Price:Sales is a very low 0.34. Earnings seem to have bottomed out and are growing while people on chat boards are still saying disparaging things about it. Also, while the Dow, S+P and $COMPX were all red today, SPLS was actually slightly green. All of these are bullish indicators of a stock that is likely bottomed.
While Sid's chart shows the detailed count, I would also like to show that the chart is at major long term support (which his chart is too zoomed in to see). That is very important and it provides a clear trigger level for exiting the trade. If SPLS cannot hold the orange line, walk away quickly because SID's count will have been proven wrong. By the way, taken as a whole we have a fish tail formation going back to 2001. That is a very mature chart formation.
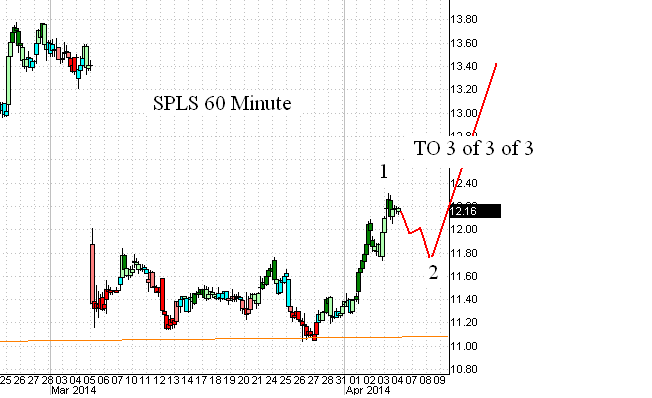
We should now be staring straight into the teeth of not just a 3rd wave up, but a 3rd of a 3rd. I expect this one to gap and go in the next few months. Again, while the broader indices might be in trouble, not all stocks are in phase with the S+P and Dow and $COMPX indices. It is really a blessing to find one that has been going down while everything has been going up because as other stuff begins to crash, where do you think some of that money is going to go? That's right, into the beaten down stock that is paying a nice divvy and that looks like a turn around play.
SID's minimum price target from here is $17.87. The stock is trading at 12.16. That's 50% minimum without any leverage or options (just another form of leverage). His high target is 28.76. You do the math.

Now, let's look at the exact best time to buy. Per the chart below, 5 small waves have happened since the 2nd wave low was put in. Don't chase!! Let it A-B-C back to the level of the prior 4th. When you see 5-3-5 waves transpire, jump on this baby. At that point you have a very, very actionable trigger for bailing on the trade if the count turns out to be wrong. But the waves on this one look pretty clear so I'm going to give it a 90% chance of playing out like Sid modeled it. Again, the wave count should drive the purchase decision but I expect to see the 5th of C bottom at about $11.80 per the model below.
As usual, fellow gamblers, may the odds ever be in your favor.


No comments:
Post a Comment