All numeric labeling below refer to the bullish count. It basically says we had black 1 up and then a massive zig zag consisting of a 5 count, a 3 count and a 5 count into black 2. Then black 3 started off with red 1 which then did an expanded flat into red 2.
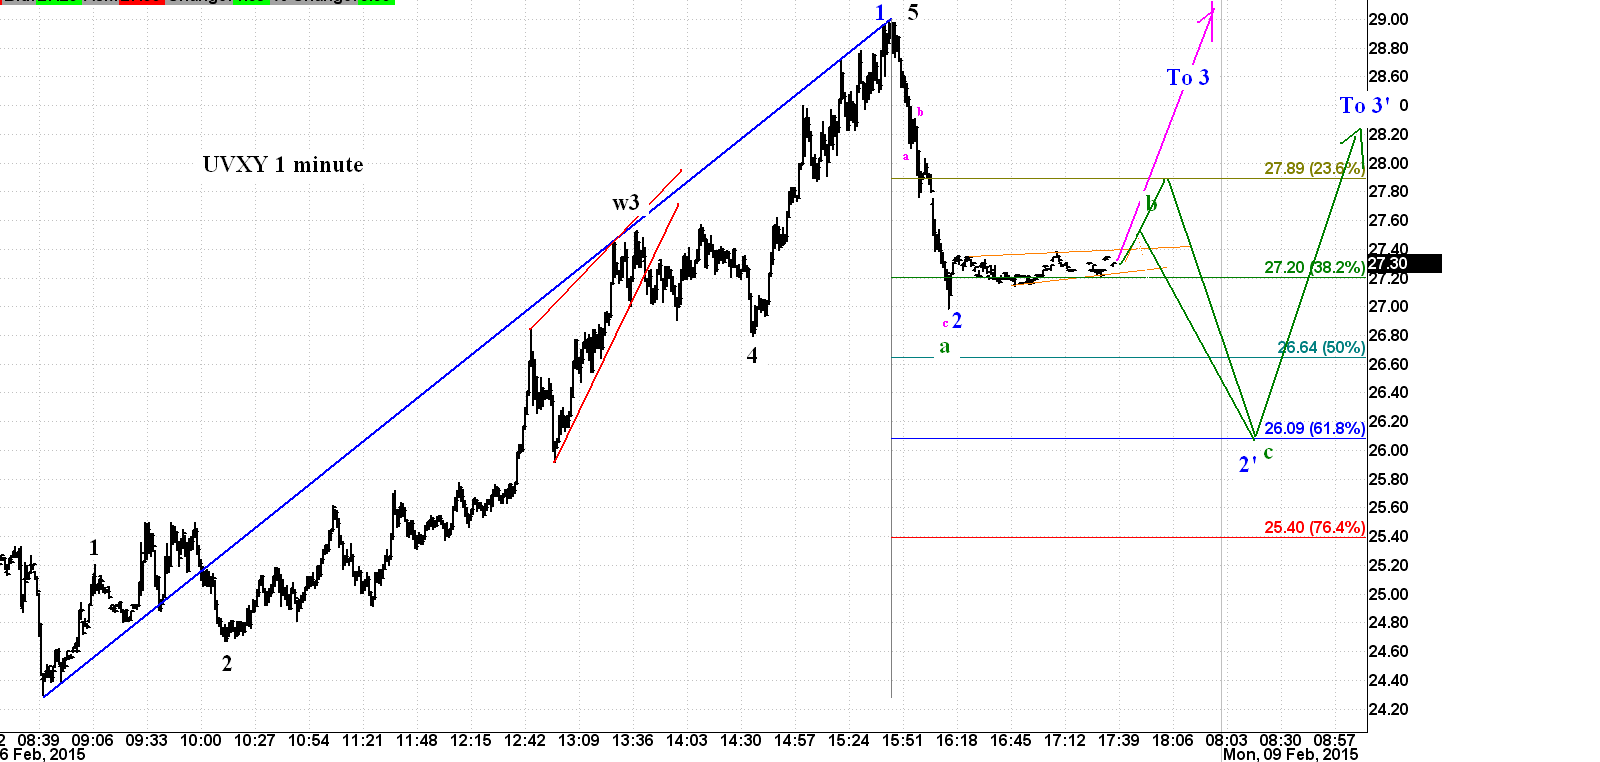
The main thing I like about this bullish count is that the lower rail has remained support leading to a series of higher lows. If that lower rail cannot hold, GTFO of UVXY! Another thing I like about the bullish count is shown in the zoom in chart of UVXY (2nd chart down). The count can be interpreted as 5 waves up from the bottom and indeed I used this count to sell out at an 11+% gain near the close as support began to fall away. Then in the extended trade we see something that could be an A wave or an A-B-C to the level of the prior 4th.
The bearish count will be demonstrated with the DJIA chart below but the one thing that UVXY does show is a rapid move back up to the level of the prior 4th as highlighted by the pink rectangle. All you need to know for Monday is that a lower low than today's low seen in the extended trading of $26.99 should be a hard stop loss order with an eye toward potentially buying back at the 61.8 fib (again, refer to 2nd chart below).

Zooming in we see that the rally today can easily be counted as 5 waves up and then either 3 waves back into blue 2 at the 38.2 fib. Alternatively, that extended trade pull back could have just been A of C meaning probably a kiss of the 23.6 from below without breaking out and then a sell off into the real blue 2 (2' in the model) at the 61.8 fib.
Note that the chart below includes extended trading even though it is not marked as such. UVXY is often very active for the first 90 minutes of extended trading.
Below is the bigger picture of the DJIA and it basically says Monday or Tues could be a DJIA sell off back down to kiss the top rail of the HT followed by 5 rapid waves to break out the top rail of the larger rising wedge. Note that this count could look very similar and perhaps be indiscernible from a count where after E of 4 of the HT we get 5 good sized waves up to a higher high than black 3 (in other words, the count I have been talking about for a couple months now). The different between these two counts could be very subtle but very important: near the turns, the use of rare or subtle rules keeps the most people guessing wrong.

If this does the indicated a-b-c pullback next week and then takes off to higher highs, most EWers will look at the size of that 1st wave and calculate a likely 5th wave target of DJIA 20k. However, if the market treats this as a large rising wedge then interior structures are not 1-2-3-4-5 but rather a-b-c. And so far everything about this wedge could be counted as a series of a-b-cs without using too much imagination.
None of the EWers out there that I follow are calling this count so keep in mind that I am a majority of self on this one. Still, a count is a count and I seem to have a reasonably hot hand of late so maybe I am in tune with the herd a little better than the other guys at this time. The above DJIA chart is now my primary count. That will change quickly if the upper rail cannot hold and it mos def changes if we see 5 waves down from the blue "a" where wave 3 down on Monday would take out the top rail with gusto.
Because I don't know whether the pink or green path will be taken on Monday in the UVXY 1 minute chart, I bought a 1/3 position @$27.22 after selling the obvious break down of the 5th wave peak near the close.


No comments:
Post a Comment