
For people that might be bewildered by this, this massive volatility has nothing to do with refinery capacity, new oil discovery or production or anything else of the sort. It has to do with the world trying to figure out what the petrodollar is still worth. That is a daunting task because in fact the paper money is worthless even though most people do not understand this basic economic fact. They are fooled by the fact that people still accept the paper in return for their goods and services. Still since the whole world runs on fake money, the real question becomes relative: is my fake money better than your fake money?
Rest assured that at some point in the not distant future, all of the fake money will be worth nearly nothing as the world goes through a global economic reset and fiat currency is rejected in a rapid chain reaction by all nations. Yes, it's a crazy sounding claim but the fact is that the US is running a debt Ponzi based on the USD and Ponzi schemes always collapse eventually. Since all other paper fake money is tied to the dollar and since nobody wants their fake money to appreciate in value lest the savers who hold it actually get a fair shake, once the USD goes down, it all goes down. We are the linchpin in the pyramid shaped house of cards.
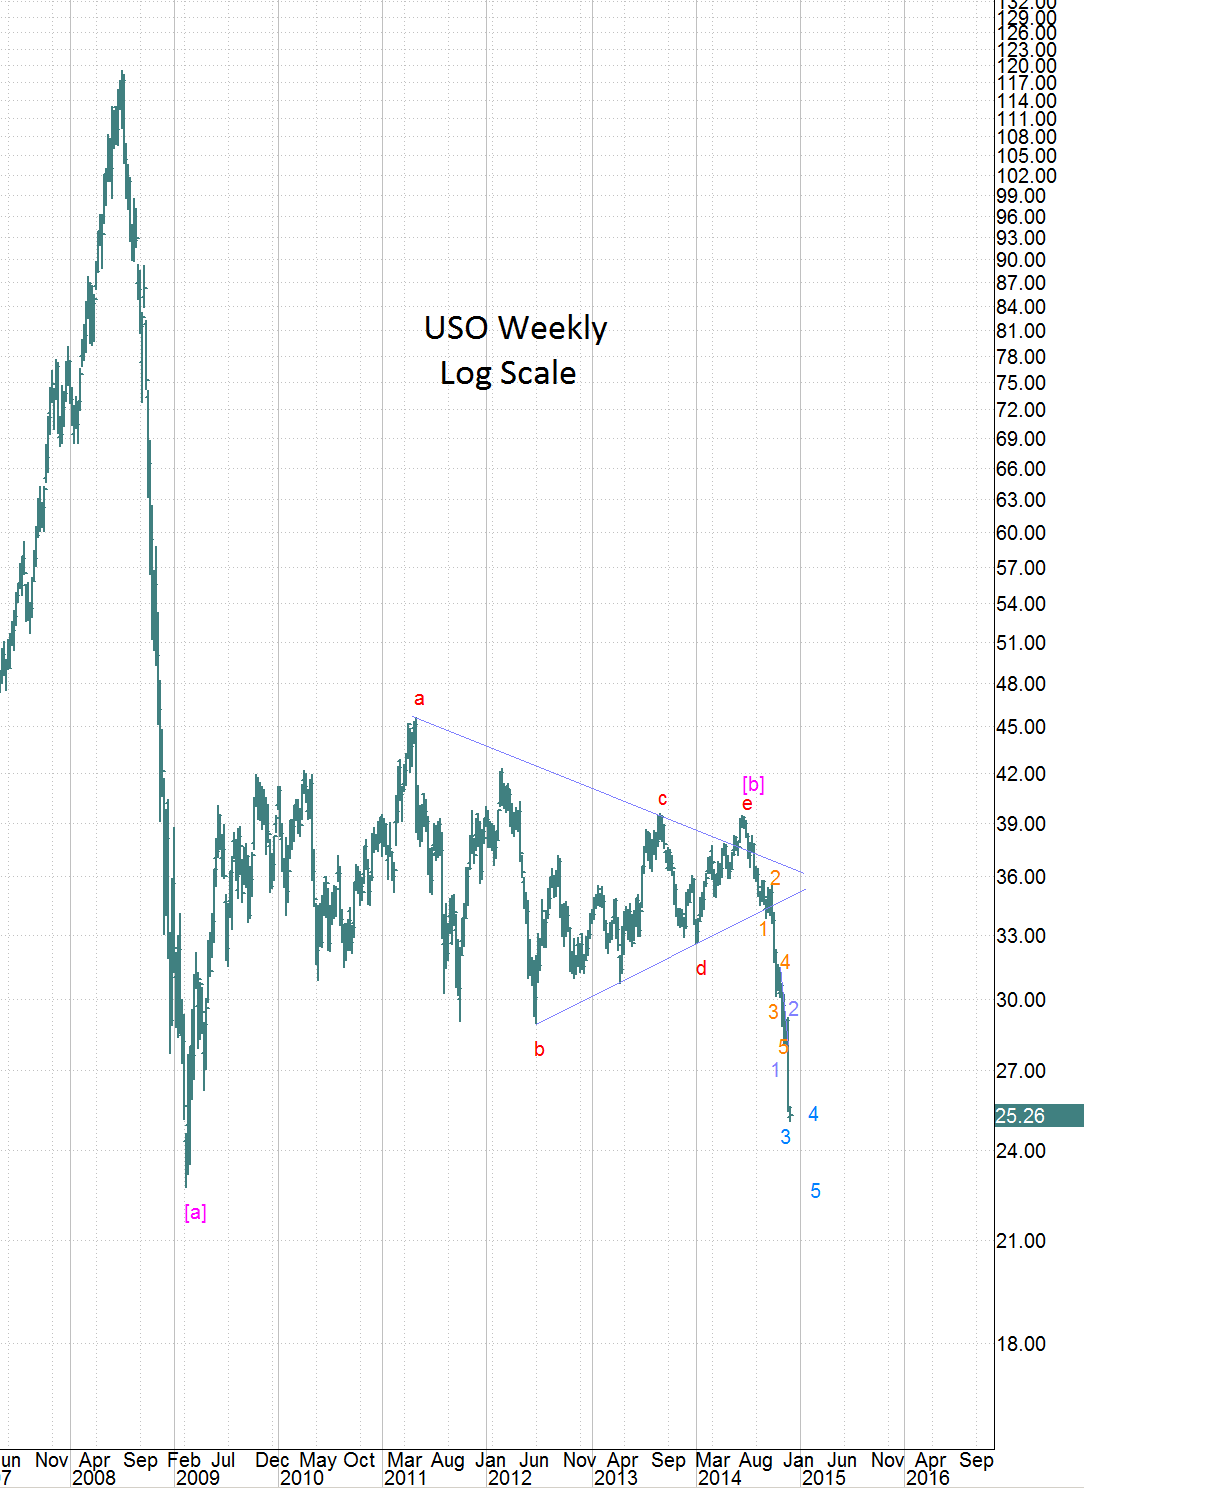
In any case wave A of the correction happened in early 2009 and since then we have been tracing out the B wave. The C wave seems to have begun in mid 2014 and is picking up speed right now.
At the lower level it is always difficult to know the exact wave count so below are my top two counts. The primary DUG count (remember: inverse of USO above) is on the left and it says that mid 2014 was the low and that since then we have wave 1 up, 2 back down and are now working on 3 up.
The alternate count on the right says that the recent DUG bounce to ~$60 was an a-b-c and that it came back up to the level of the prior 4th. Thus it was some kind of correction, probably blue 4 as shown and now we get one more spike in oil which equates to one more drop in DUG before the real correction upwards begins. If you are playing this, a DUG high above the recent high of around $58.80 means that the alternate count cannot be correct.

Time will tell how it actually plays out but all of this massive global volatility is not healthy and it is not a sign of of a healthy global economic system. I want to stress here that it is not the economy that is bad; it is the system itself which is bad and corrupted and which cannot continue in the same form as it exists today for very much longer.


No comments:
Post a Comment