With a few more days of data in hand we still do not have the final answer but the odds of a wild capitulation bottom down into the low $2 range are falling rapidly with each day that TVIX continues to hold the $2.65 floor. I'll preface the following models by saying this choppy shit is very difficult to read and that is as intended. It is supposed to be difficult to catch the exact bottom on this. It is supposed to wear you out with head fakes and whipsaw. Those who manage their risk while trusting that the broader markets are at or near peaks will be the winners here.
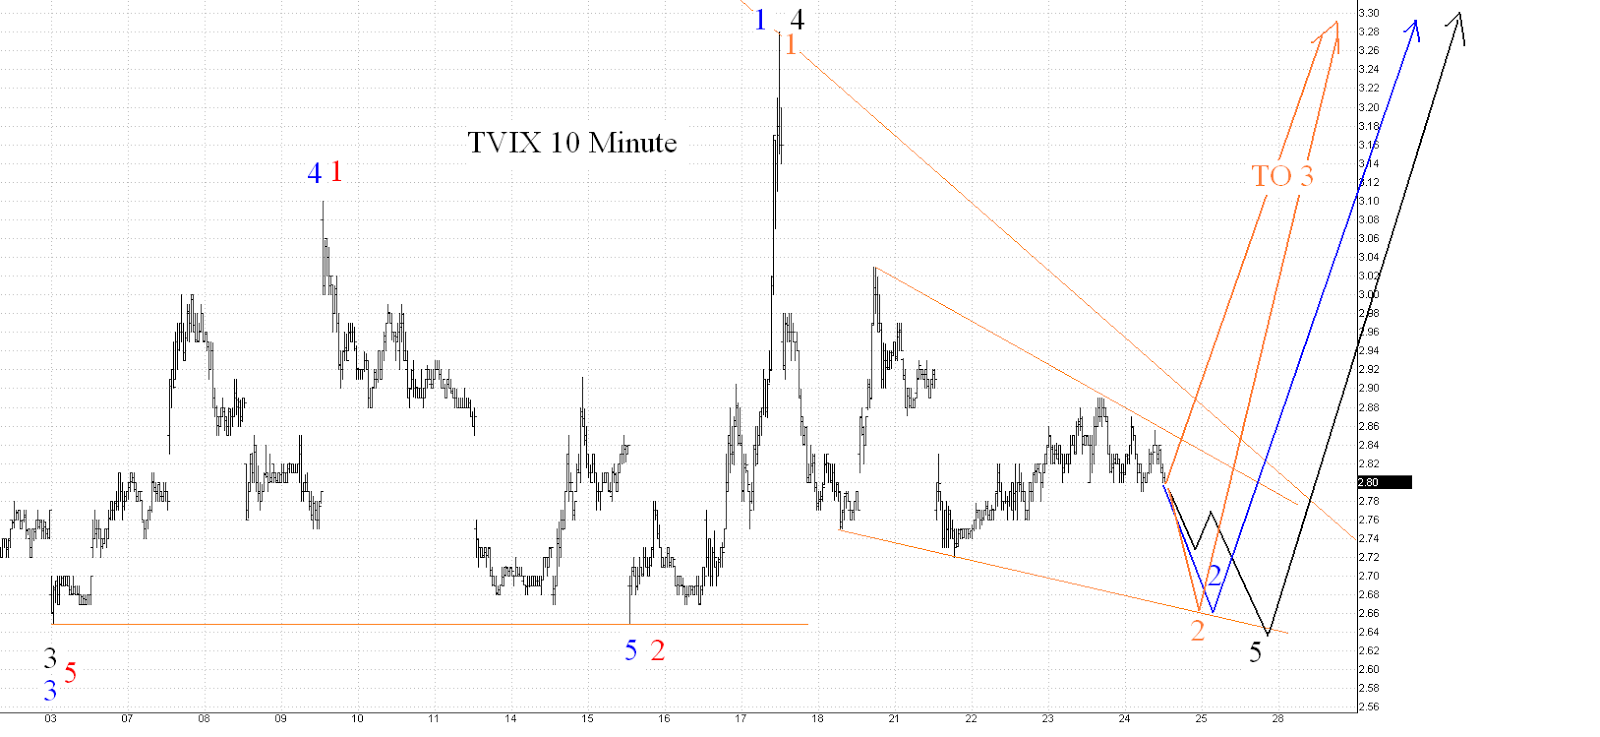
There are 3 models multiplexed on the chart below"
- the black model says that the ending diagonal was wave 3, then we got an a-b-c sine wave into black 4 and then we saw wave 1,2,3,4 and part (or all) of 5 down. Wave 3 does not want to be the shortest here so don't automatically assume a trip all the way to the bottom of the ending diagonal but it would result in a slightly lower low than black 3 and that is what the 5th wave is supposed to do.
- the blue model says that the ending diagonal was wave 3 but that the first hump after that was 4 and then the next wave down was blue 5. Following that was the first wave up of the new bull market in TVIX and everything since then has been wave 2 back down. Note it has not seen a lower low than the starting point for blue 1 and in fact it cannot do so and still remain a valid model. If the blue model is the correct one, we should see a hard bottom in the next 1-2 trading days and then a massive move up into a 3rd wave.
- the red model says that the ending diagonal was wave 5 down, then the next wave was actually wave 1 of the new bull. The red model then changes color to orange to indicate subwave. The 18% move was therefor 1 of 3, everything since was 2 of 3 and very shortly we should get a massive gap up into 3 of 3 in this model.
Other outcomes are certainly possible. If I had to pull triggers out of this:
- anything below $2.65 is likely a sell and if it then goes back up above 2.65 you re-buy
- anything above the down-sloping orange line that touches the peak of the 18% spike likely means breakout in progress but a subsequent break back below means back to the sidelines and wait.


No comments:
Post a Comment