Note that leading into the panic of 2007 we can see several waves down although this does not go back far enough to see the whole motive wave. However, we should be able to assume that the inclining double bottom leading to the 2009 peak was actually an a-b-c movement thus implying that Nov 2007 was the bottom of either a 1st wave down or a 3rd wave down (meaning we are either at the end of a 3th wave down or a 5th wave down today). Two important facts are:
- following the TVIX bottom in early 2007 we saw a 3 wave movement which took us to about the level of the prior 4th. In other words, EW rules do seem to be applying to these charts (as if I really had any doubt that they would...).
- the a-b-c move was not a vee wave. More on the importance of this later... think alternation.
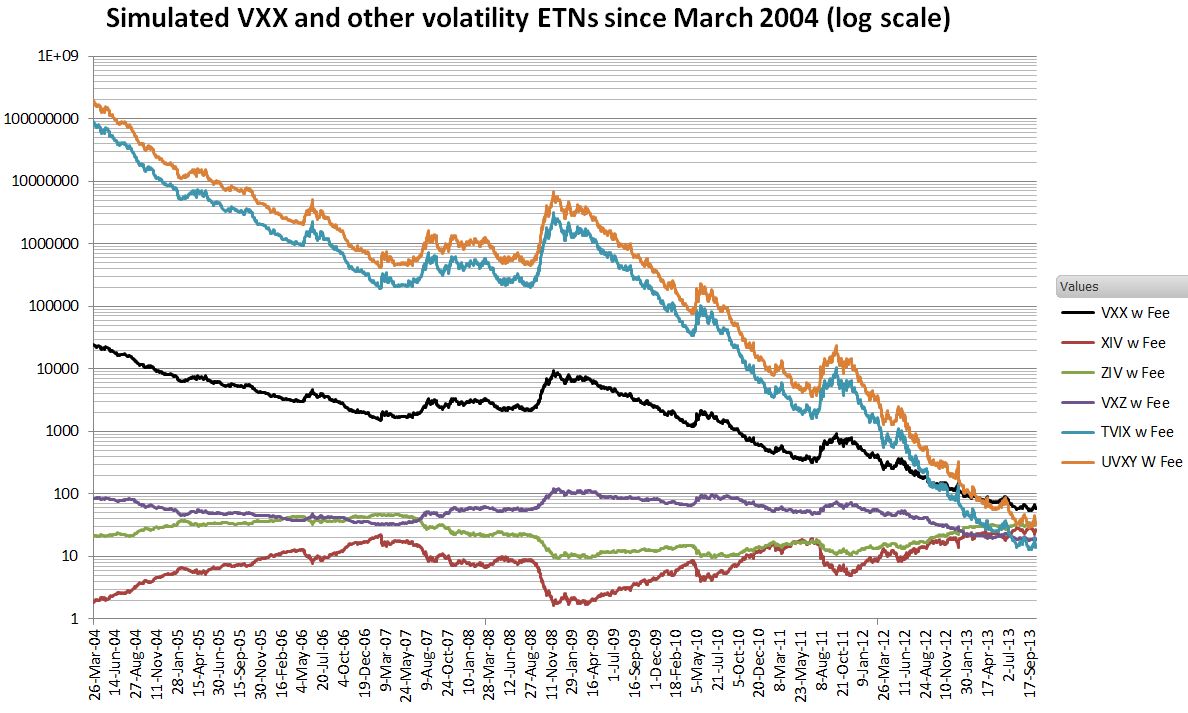
To net it out, the last big TVIX run started at about 110,000 and then ran up to about 1,225,000 for a gain of about 1100% (an 11 bagger). Obviously the collapse of a grand supercycle is going to be significantly bigger than a collapse of "just" super cycle degree. How much more is the real question.
In order to see the full picture up to today, I added recent data to the above chart to achieve the following wave form and associated wave count. It turns out to reveal something very interesting as you can see below. Given that we know that 2009 was a major wave up, I have to assume that everything after that was part of a different motive wave down.
However, notice how long black 1 is. I measured it against the next wave down and found that the next wave was shorter. Then, the stuff following it was longer. Thus I cannot assign the wave down which ended in Q3 2011 the designation of black 3 (3 of 5) here. It must therefore be that we are really working on black 3 still (5 of 5 to be more specific) and that this 3rd wave is the extended wave. With this idea, I added numbering for waves red 1-5 appear. Lo and behold, wave red 5 that we are working on right now is about the same length as red 1 while red 3 is extended using blue 1-5. This is very compelling evidence that we are working on black 3, and very near the end of it.
 This additional information strongly suggests that we are really not at the very bottom of TVIX here but rather at the peak of wave 3 of the stock markets which will be followed by a nice a-b-c decline into wave 4 only to have a real subsequent 5th wave up probably in early-mid 2015. This would, of course, confuse everyone and thus has higher odds of happening.
But now we at least know what to look for, don't we?? Now I want to circle back to the fact that the 11x bounce last time was not a vee wave. By the guideline of alternation, the 4th wave bounce should thus be a vee wave characterized by rapid movement per unit time, not lollygagging about like wave 2 (2007-2009) did.
We should thus be looking for an a-b-c bounce which takes us roughly back up to the level of the prior 4th. Well, the prior 4th was in June 2013 at about $39. From the (current) low of 2.65 up to $39 would be 14.7x or nearly a 15 bagger. This is nice but it is not 40x. 15x is not going to be the full payout for a grand supercycle collapse folks. No way no how.
In any case, the approximate level of the prior 4th is one thing to look for. But even more importantly we need to look for 3 waves back up consisting of 5-3-5 (a-b-c). Once we see that, just get out because at the very best we will have to endure a large pullback into wave 4 of 1 up and at worst all of those gains will evaporate very quickly as TVIX finds a lower low (or a double bottom) into the real wave "black 5".
It all makes sense from a political perspective as well:
- Yellen tries to rein in the excesses by completing the tapering and shutting down all of the other back door stimulus that they are not telling us about (do you really think they are telling us the full truth when their very lives could be on the line here???).
- Then the market throws a hissy fit tantrum and many scared sheeple clamor for the government to "do something".
- And so Yellen has to reinstate QE and then do a lot more on top of it in order to tempt the markets back into what will obviously be a situation of increasing risk. Tempted by the additional free money, the market begins to head back in but at some point something happens (unintended consequences) and the whole thing begins to collapse anyway. More stimulus leads to bigger losses as the law of diminishing returns kicks in. I suspect that "unforeseeable" thing will be skyrocketing interest rates which begin to kill off the leveraged market participants. At that point it becomes clear that Yellen really isn't in control of shit and the markets panic never to return to these levels again in our lifetimes.
- Sounds crazy, right? Conspiratorial, loony, blah blah blah. Time will tell but I know that this fake money system must at some point collapse. That is math talking, not emotion. There will come a global reset and much sooner than people believe is possible.
One more thing, and this is very important. I have been lumping all of these artificial trading vehicles together under the term "ETF" out of convenience. But the above chart calls TVIX an "ETN" and so I feel compelled to explain it once and to point out the implications. This site does a good job of differentiating between ETFs and ETNs but as far as I am concerned there is really little difference. Both are just promises to pay something.
The ETNs just tell you outright that they are debt based instruments even though the ETFs are also just promises (debt). In any case, if the guarantor of this ETN debt, Barclay's bank, goes BK then you will get stiffed. Theoretical performance of an ETF or ETN is meaningless if the entity which is on the hook to pay up if you win simply says "I am declaring BK; get in line with the rest of the creditors not only to try to claim your winnings but also to try to get your principle back". Understand that this casino is fixed in the favor of the house. As long as the Ponzi is running, they win and when it stops running, they don't lose. They just flee the country and hope we don't track them down and string them up. Literally.
What I'm telling you is that the coming collapse will be so great that Barclay's will probably BK. So there has to come a point when TVIX investors who could be sitting on big gains soon simply decide that Barclay's is too near BK and thus TVIX is too risky to stay in. The site listed above says that Barclay's is a 300 year old bank and thus safe. It mentions that it has 1.5 trillion in "assets" as proof. But those assets are valued using a credit pumped money supply and so that valuation ("market cap" is completely fake. Barclays' size simply means that it is a monster leveraged pig and thus very likely to BK in the coming years.
When banks, especially Barclay's, begin to get credit downgrades again then be afraid, very afraid. Just a few weeks ago, Erste Bank admitted that it had unreported losses on its books. Only a couple weeks later, it upped that number by 40%. So you see how quickly smoke can turn into fire in this Ponzi. When (not if) you see more smoke at Barclay's, consider banking some profits at least so that you are made whole.
This is where some real excitement comes in for me regarding the new long term wave count revealed by the reverse calculation of the ETF performance shown above. It means we are not yet headed directly into disaster. The world is not going to fall apart because of the expected wave 4 pullback. It will continue to keep its promises until wave 5 up plays out and then likely still be in reasonable looking shape until wave 3 of the subsequent decline. That is when the odds of getting stiffed out of your winnings rise exponentially. So, the profits from this coming a-b-c bounce should all be paid out without default. A 15 bagger is good money folks but it is even better when there is an element of safety built into the wave count like this.
If it works out like this and we see the a-b-c into about a 15 bagger, I will just sell all my TVIX and be looking to flip long. Then wait for 5 more waves down to either a double bottom or a lower low on TVIX ($2.00??). Then I will consider flipping short again into TVIX for at least wave 1 up into the new grand super cycle bear market.
If done right I could multiply my 15 bagger by another 15x into wave 1 of the new bear (on top of what is possible to make during wave 5 up into the final bull market peak). After that it might just be best to pull all my money out of all brokers and then pile into physical gold and silver IN MY HANDS, not promises from some lying fuck. Also stock to the gills on food, buy that bulletproof vest, etc.
I'm pretty sure that BCS (Barclay's) will BK in wave 3 of the coming collapse because they almost did just that during the last collapse. Their asset pile is now too big to sell without tanking the markets. $1.5 trillion is too big for Great Britain to bail out. Default and BK is the only way out. They clearly have no exit plan. None of them do. There is no viable exit plan for a big player in the end stages of a Ponzi.


No comments:
Post a Comment