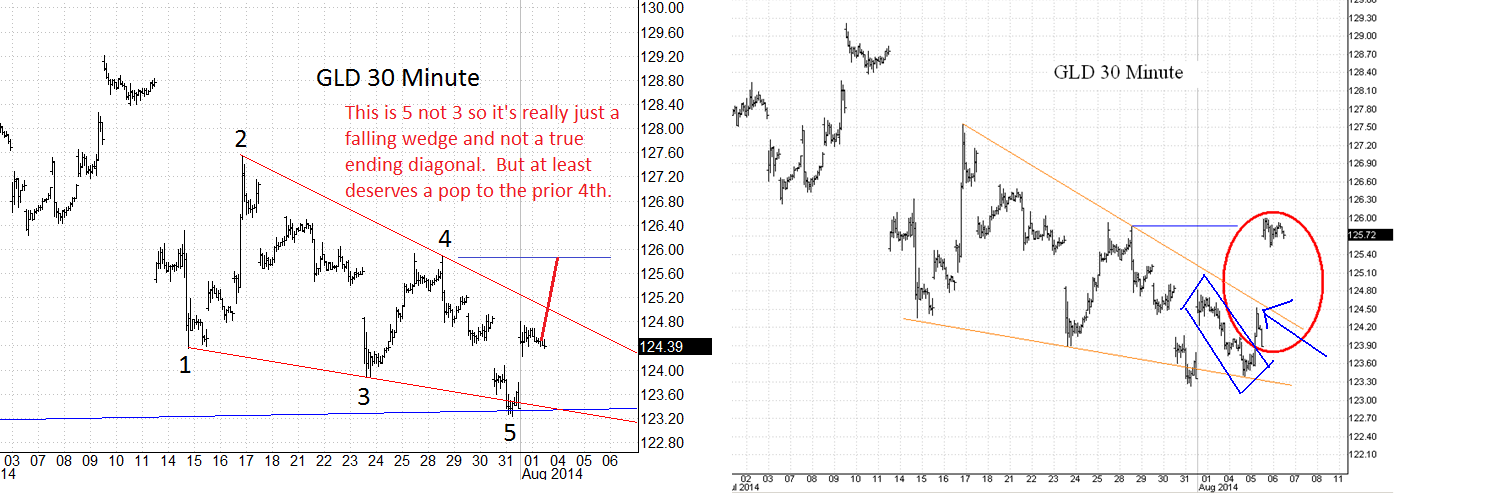
So based on the above I bought into JNUG but was quickly stopped out by the big back test within the blue rectangle below. But the expected bounce level did eventually occur as shown in the red circle on the right. that's just what happens when trying to play this bouncy crap.
In any case, I think the important things to note are as follows:
- There is a good technical case to be made for the current wave count which says that GLD (and thus miners) are either in the 4th wave down from 2011 or have already entered wave 5 down.
- There is a good technical case to be made that short stroking the E wave is not usual and so far it has been short stroked. Thus, E may not be complete despite it being EWI's primary model as of Monday.
- B wave of E should be of the same size and weight as the other waves, B of C wave being the exception and reasonably allowed to be smaller.
- The falling wedge shown below had 5 clear rail bumps with a throwunder on the 5th. It quickly broke back up into the channel "with gusto", headed back down to the bottom rail to test it from above moved up gingerly to the top rail like a shark testing its food before pouncing (blue error lower right) and then came slamming up from below in an obvious 3rd of 3rd or 3rd of C.
- All of this is a lot of technical evidence that adds up to a significant direction change in GLD (and thus the miners) which strongly suggests that E of 4 "is on".
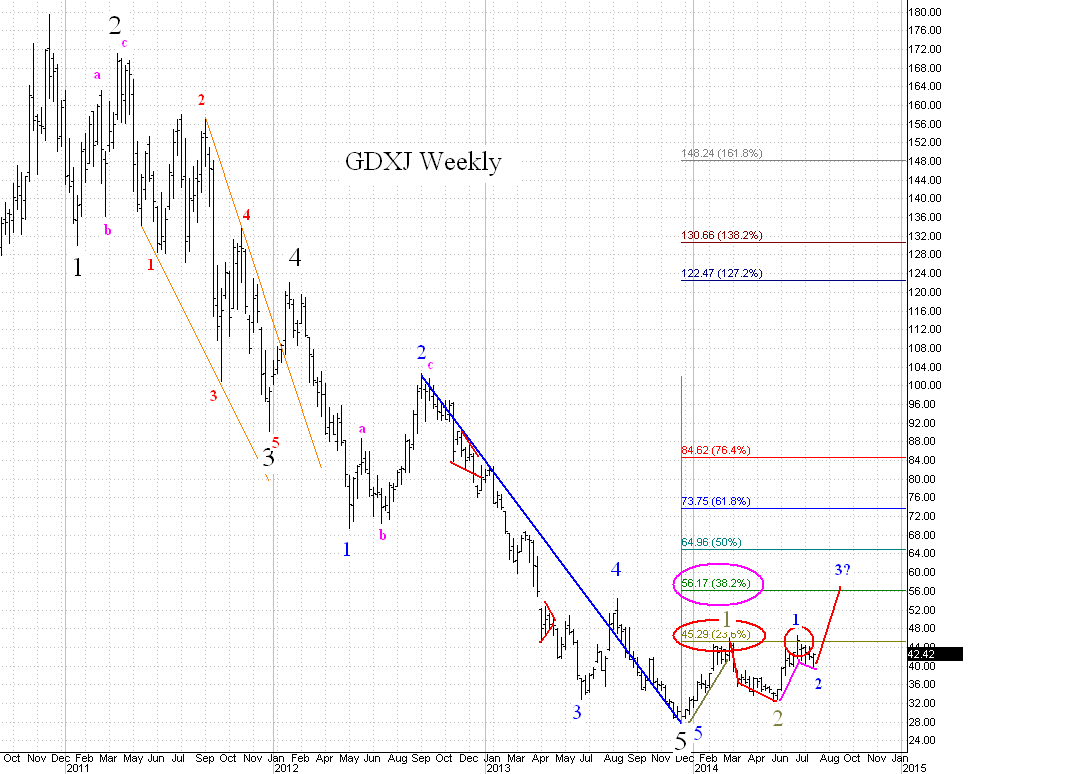
Another bit of evidence to consider is the GDXJ chart which has gotten pummeled since 2011. Again, the juniors went from $180 down to $28. And now the current best chart from many people says that gold is still in a 4th wave down. I hate to know what the juniors will look like when gold hits $1000-$1100 because that would have them bleeding in their own mines. Could it happen? Of course! But does it make sense to happen right now when there really is not major global panic and carnage yet? Again, it brings up questions.
For example, the model below could turn out to be the correct one. Note that the first wave up off the bottom was 5 waves. The next wave down was a 3 wave boomerang. Then the next wave up (marked blue 1) is shorter than the first wave up. That implies it is only 1 of C or 1 of 3. At the very least I would expect a bounce to the 38.2% fib which is at about the level of the prior 4th.
In any case, I'm back into JNUG near the close today to see if GLD moves up in sympathy with the markets. I set fairly tight stops again of $25 but if I am watching the action real time I will probably disable that and let the wave count be my guide. I would at least like to see the E wave in GLD play out before giving up on JNUG again.


No comments:
Post a Comment