Or you can lose 100% of your bet.
So short term options players spread a few smaller bets around. Most will lose but if one wins, it really wins. So I guess short term options can be like playing roulette.
But there is a difference and it is a huge one. In roulette, the odds for any number are fixed and clearly printed on the playing table. The odds are designed so that the house takes money off of the consistent players of the game. It does this because it is not like playing cards where you can, based on a system, fold or bet and draw. But playing short term stock options is sometimes warranted if the setup is good enough and such setup is not priced into the odds.
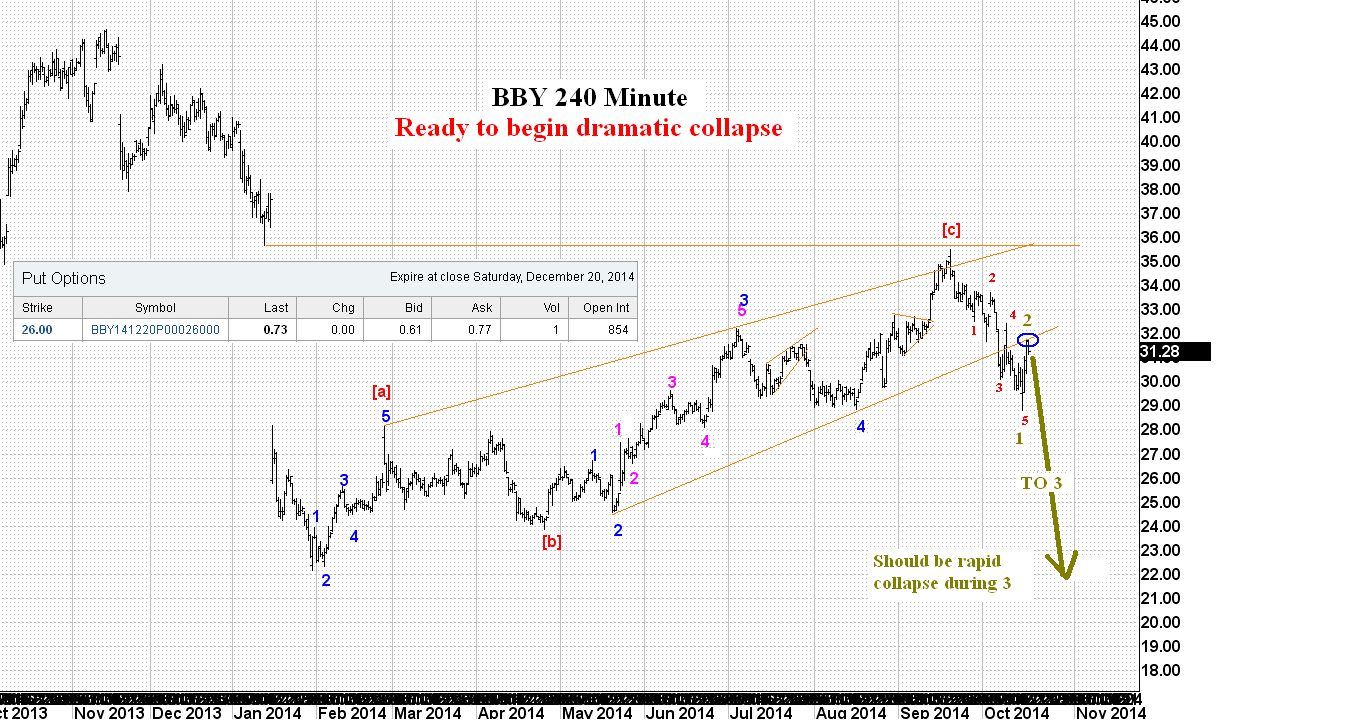
And so I will pick on Best Buy BBY. In this post I called it Worst Buy, a moniker which I think is quite applicable even if it decided to close the gap as shown below. But here's the kicker: it really did close that gap. While it was short term bullish for whoever wanted to risk being long that thing, the gap fill and reversal all but guarantee that it is back in collapse mode.
As you can see from the count below, during red 3 of olive 1, it broke down the lower rail, thus outing itself as the 3rd wave in the count. The 4th wave spiked momentarily and weakly back into the channel before breaking back down (forever this time) into olive 1. Then we got a retracement right back up to the bottom rail. I don't think there is any way to count that than olive 2.
Guess what comes next? Well, likely a 3rd of course.
(In my best late night RonCo voice) "But wait, there's more!"
Look at the long term count. BBY bottomed in late 2008 (a sign that the broader market was near a bottom). But instead of rallying since then, it put in a lower high at [A]. Then, all by itself and without any help from the broader market, it cratered to a lower low in late 2012 only to rocket into late 2013, but again only to a lower high before collapsing in early 2014.
Since then, it did a valid a-b-c retracement to fill the gap and then put in 1 and 2 down.
So this is not just a 3rd wave coming up folks. It is a 3rd of a 3rd of a 3rd of a (3rd or a C). 3rds and Cs work the same so it's like a quad 3 setup. We already know how strong A was. C will not be weaker. That means that BBY is likely to announce some kind of really bad news very soon. My first guess would have been some kind of inability to service debt. But Yahoo finance says it has $3 bn in cash, with only $1.64 bn in debt. It's even paying a small divvy still.
What else could account for such a strong 3rd or C as the model predicts? Breaking back up into the channel at the blue circle in the model above would negate this model but that would be a distant alternate count for me at this point. Still racking my brain to figure out what could be going on here but if the broader markets begin to collapse in fear, they will certainly dump BBY before the next guy can. I mean, you see what they did to the shares based on reports of a weak quarter back at the start of the year... Maybe sales will just be abysmal. This article from Jan 27th of this year compares BBY to a highly leveraged hedge fund.
Time will tell. This should be an interesting case study and I might just pick up some of the options listed above just for the heck of it.


No comments:
Post a Comment