Does this assure anything? Not at all. It's just another data point. But keep in mind that they also look at all the sentiment indicators whose data feeds are paid subscriptions of high cost. So they are looking at the chart which I can see and other things which I can't. Besides, the January effect suggested a Walk Away May and the length of this bull market is at the long end of the time scale as bull markets go. Also, the fed is talking about not only more tapering but also unwinding their balance sheet at a time when the middle class is collapsing. The odds just keep piling up against higher stock prices.
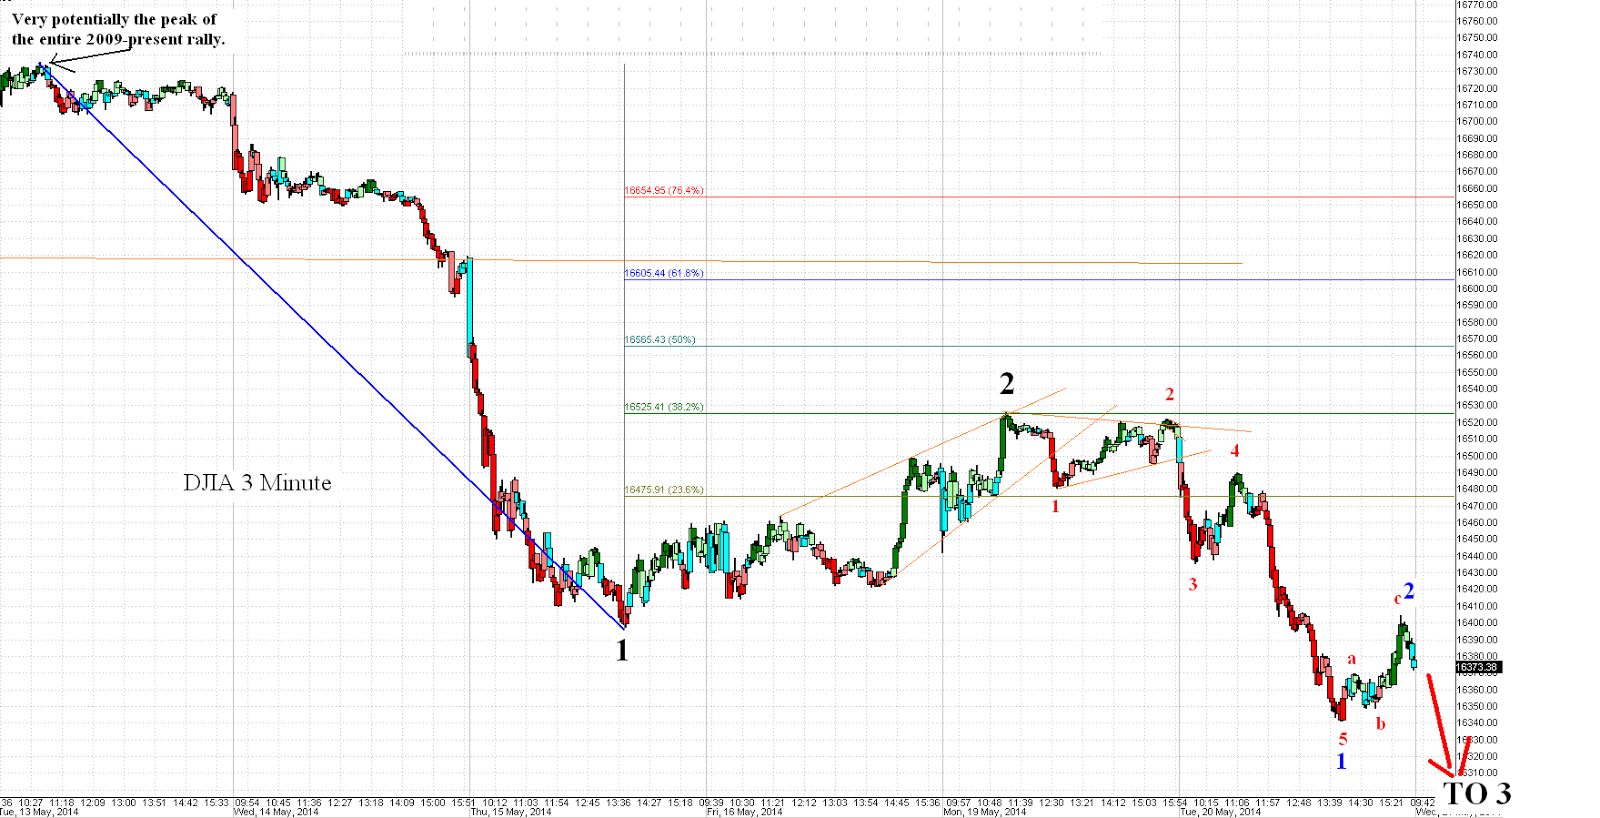
If we start with that assumption that the 13th was the peak, then mid day on the 15th was the end of wave 1 and wave 2 finished Monday the 19th. I think that today's low was thus 1 of 3 and that the a-b-c into the close was 2 of 3. IFF this is correct, we should see a very rapid move down tomorrow and it could be a candidate for the 500 point loss of the DJIA. Why? Because it would be a 3rd of a 3rd. One thing I like about this model is that wave 2 retraced exactly back up to the 38.2 fib before deflecting downward again.
Other scenarios are possible. Today might not be 1 of 3 but rather 5 of 1. This is in fact my secondary count, the one I will fall back to if the DJIA breaks 16410 tomorrow. If this secondary scenario plays out then mid day 15 low in that case would have been 3 of 1 and not 5 of 1.
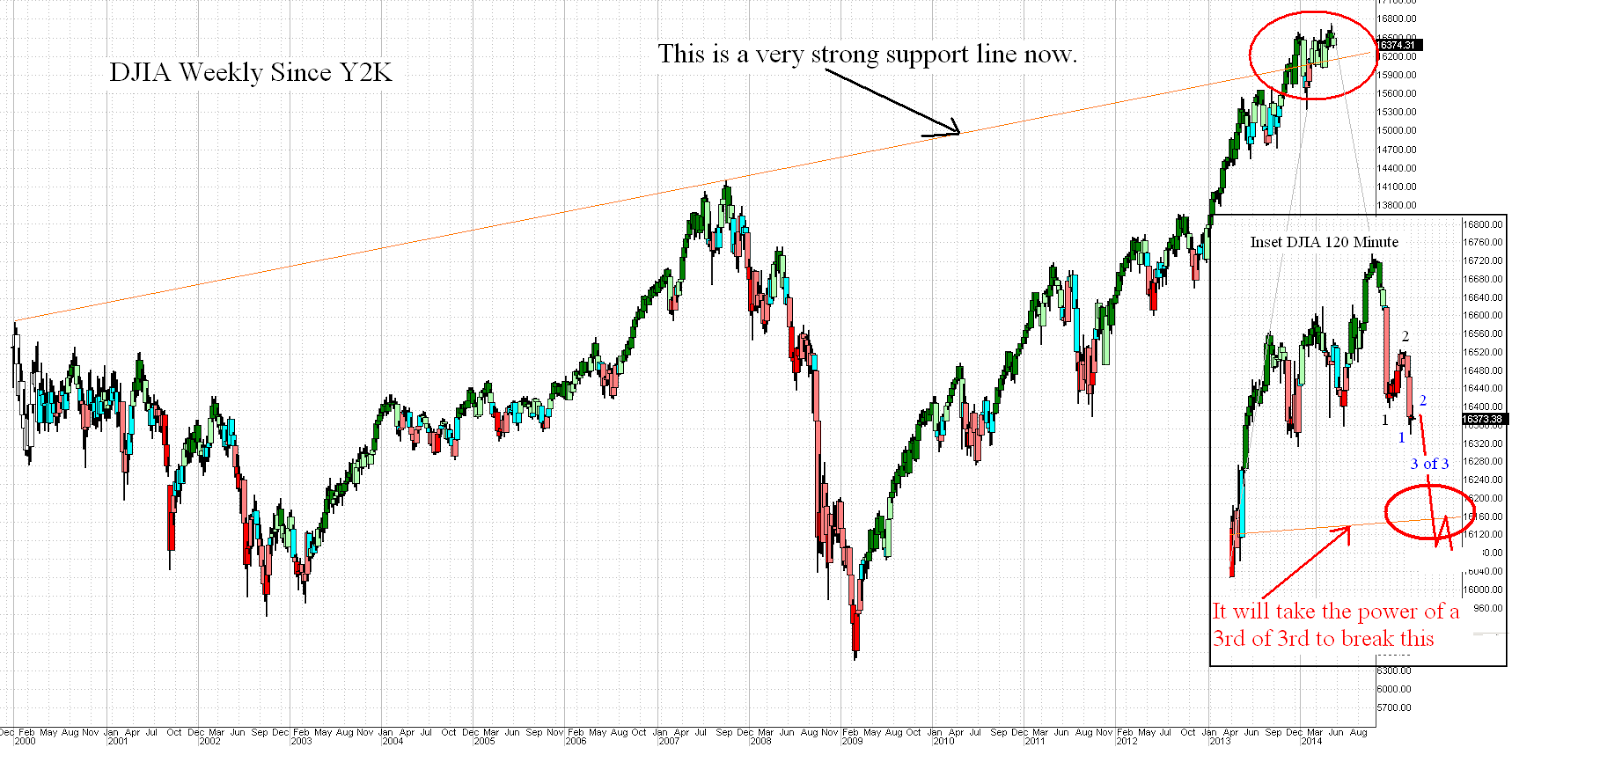
The picture above is too zoomed in to give another critical bit of information which is shown in the picture below. Namely, that the recent breakout to new highs was a throwover of a very long term trend line shown in orange. It took a LOT of energy to break that resistance and so many will consider it a strong support level. That doesn't mean it must provide strong support, simply that many are not expecting a break below that line. They think they have broken out and new heights await their fantasies. If that line breaks down, the wings melt of of Icarus's Dream and it will be a moment of recognition that the breakout was a head fake and that means lower prices should be expected.
With this in mind, a 3rd of a 3rd could happen tomorrow that would take out that support line and, as 3rd waves are designed to do, become a point of recognition for the markets. Once the herd gets wise that the pump is over and the dump is on, they will not be squeamish about selling because the pros know how fake the valuations are. They are based on government support and the use of margin debt. This is not real investing, it is pump and dumponomics. So when they see the herd turn south they will NOT try to stand in front of it, they will just sell first and ask questions later.
If we don't see that kind of selling tomorrow then I will begin to wonder if I got the model wrong. I expect a small move up at the open - perhaps 15 meager Dow points to finish a subwave and then reverse and head down very hard. So, perhaps we see 16390 right after the open but should not be more that 16405 or a rethink is needed.
If this breaks down below that orange line tomorrow, this will be a major, major technical turning point, in fact the most important one since 2009 IMO.


No comments:
Post a Comment