Monday, June 23, 2014

FAZ looking very good for re-entry here.

The FAZ chart is really looking like a bottom here.  I can see the possibility where the wave that just finished is not really 5 but rather part of an large ending diagonal but if that is the case then the crash will be put off until darned near Q3 and with major companies taking hits following earnings, I just don't think we have that much more time.  I think Q2 will show negative growth and it will blow away all the excuses about bad weather causing -1% growth in Q1.  2 Qs in a row=recession.  The market participants will scamper for the exits if that becomes the official word.

This is an easy, easy trade.  Buy at the open and set your stop for just 10 cents lower than today's low.  Do keep in mind that this could just be 3 of 5 of 5.  But something tells me this could be numero cinco.  Time will tell.


Double bottom for TVIX looks like a nice entry point.

If interest rates do begin to head up tomorrow as modeled here, the stock market should begin to show weakness.  TVIX should respond to any weakness in the markets.  Perhaps all that last week's quad witching really did was to delay the start of the new bear market by a couple of days.  This would, in fact, confuse a lot of people both short and long.

Below are my current models for TVIX.  What I had been calling 5 was likely just 3.  You can see that the bounce to red 4 was clearly a corrective a-b-c.  And today we saw 5 waves down into the close.  In all fairness, this could just be 1 of 5.  If so, a very tiny a-b-c to perhaps $3.07-$3.09 could happen before a 3rd wave down to $2.85 and then finally a small sideways 4th and then the final 5th down to $2.65.  But if we go higher than 3.20, the bottom for this wave since April 15 is most likely in.  $3 is a nice round number.  If this gaps up above 3.20 then I will be buying into that strength and I will be holding with significantly more conviction that I have been doing for the past several months. 

Like all models, this one could be wrong.  If so, it will peak out before going above red 4 in the left picture below and then break to a lower low.  In that case, my target will be $2.65.  I don't see that happening but we will most likely know tomorrow.

We are getting into the very final days here IMO before the official start of the bear market.  Too many companies are gapping down on earnings now and not just small ones either.  Couple that with the declining margin being used and it's a recipe for lower stock indices along with skyrocketing renewed interest in buying collapse insurance.

TNX update: interest rates should begin to take off starting tomorrow.

TNX is the ETF that tracks the 10 year treasury.  Yellen has told us that she will both taper AND expects interest rates to stay low.  I call bullshit.  The fed doesn't control interest rates by decree.  They want people to think that they do but they don't.  Interest rates are set by buyers of government debt.  If, all things told, the interest rates are too low, savings will be invested elsewhere.  While price inflation was low and while the US government's "full faith and credibility" held any water, the US treasury seemed like a good place for people to park their money in turbulent times even if the interest rates were low.  But as the government loses credibility, the national debt, which requires the buyer to trust the government to repay, becomes less desirable to hold.  the result?  Buyers demand higher interest rates in order to convince them that it is a good deal.

By the magic of QE, the federal reserve became the largest buyer of US treasuries for several years running (and still are).  As QE tapers, where is the money going to come from to buy all of the debt that government generates not to do special projects or anything like that, but simply to maintain the level of national consumption (including a healthy dose of corruption) that we have become accustomed to?  With the fed backing off of treasury purchases, rates have nowhere to go but up.  Higher rates = lower stock market valuation for two reasons:
  1. main reason: it increases the service on margin debt.
  2. historical reason which is secondary right now: higher returns on less risky assets mean people do not have to wade into the stock market in order to generate the returns needed to fund retirements.

I believe that wave 2 is in the books right now and that wave 3 is already in progress. People who don't know how to count Elliott waves will think the recent chart action is "rolling over".  They will change their minds about that when the rapid 3rd wave action unfolds.  The 3rd of 3rd should see some nasty gaps up that should really put some fear into the stock markets.

Facebook update

When Facebook turns down it will be in the company of the $COMPX.

Here is my last post on FB.  The model there incorrectly read wave 1 of 5 as being the entire 5th wave.  The updated model is below.  A break below $63 will confirm that wave 3 is in progress.  A move above the red horizontal line means the model is bust.

Quad witching cannot hide Oracle chart breakdown.

Oracle (ticker: ORCL) is now joining the smaller NASDAQ players in breakdown.


Here is the close up of just the 5th wave which is counted by the purple numbers top right:

After a few of these big "safe" names begin taking big losses, the herd will get increasingly nervous.  Remember, much of the market "valuation" is nothing but borrowed money.  The margin players will have to sell on any real, broad weakness.  The selling will thus feed upon itself.

Sunday, June 22, 2014

Good reader question warrants separate post.

In response to my last DJIA update, reader Steven B commented:

"I'm sure you listened to Yellen last week, someone needs to come up with an adjective for dovish that's means EXTREMELY MAXIMIZED dovishness. How much longer/further can the proverbial can be kicked? How long is this road, anyway? What will cause interest rates to rise, and approximately when? Possibly a nice, round, 20000 Dow?"

I think many should have the same thoughts as Mr. B. and so here are my views on these issues.  First  nobody really knows how long the insanity of crowds (the herd) can last.  But the turn will come when least expected and it will have to be very tricky and elusive lest everyone get rich on it (a mathematical impossibility).  Lots of people saw the ending diagonal and reported on it and we also got options expiration (quad witching) which I also mentioned late in the model as a risk item.  The herd saw too many crocs lined up for easy lunch and decided to find a new place to cross the river for the coming southward journey.  We know it is time for that migration to begin because we are getting too many indications like this recent one from today that nobody wants to take on more debt despite record low interest rates in effect.


As for Yellen, I would not put too much stock in anything she says right now.  Bernanke was the master con man and Yellen will be the disposable fed.  Besides, despite the characterization of her being extremely dovish, the tapering continued.  The balance sheet of the fed is full to the brim with crap assets which have no buyers and must thus be "held to maturity" as if that is some kind of a workable strategy.  The fed will get a few measly points of interest on this while the notional value of them collapses in the face of rising interest rates.  So yes, the fed could get repaid all those trillions thus saving face but the purchasing power will have collapsed on the repaid money because of cost push price inflation.  The market is going to test Yellen and then some in the coming months.  I think she will show weakness or the wrong kind of strength and the market will decide not to trust the power of this new lead con man to fool the people any further.  When confidence goes, so will the con game which is the paper asset market.

As for timing, as you know, my last model for DJIA peak went bust (odds, not certainties) and so while I formulate a new one I am away from TVIX and playing JDST for now, probably flipping into JNUG near the close on Monday (assuming a big JNUG swoon that day of course).  It will not surprise me to see TVIX hit the low $2 range before finding a bottom.  These leveraged ETFs tend to do that quite a bit at major turning points.  That observation is not a model, and should not be misconstrued as one.  It just means I would not be surprised or dismayed by it and in fact just the opposite.  I also think it is possible that TVIX might rally first next week before the final swoon, especially if the DJIA ends up just doing a bigger ending diagonal than the last model.  For example, one that I am now looking carefully at is below.  That triangle close on the DJIA is either a 3rd or a C.  I'm wondering if it will turn out to be C of B of 4 as shown below.  Holding that lower line will be key to this model:


As for psych targets, I think DJIA 20k is going to be a good deal too much to hope for from here.  But the fact that you mentioned it means it is probably on many people's minds.  IMO, S+P 2k is more likely to be hit first (only 37 S+P points from here).  Remember, Q1 had 1% negative growth.  This has initially been blamed on bad weather but  I expect it to be revised downward to -2% when the next reading comes out.  I also think Q2 will have a negative headline number growth.  2 quarters of contraction=recession.  Markets will not stand at record highs in a recession!

It is always near the peaks when our "reactive mind" makes us doubt what we know to be correct.  It is what caused many long term bears to throw in the towel in the last 9 months including Dennis Gartman and Hugh Hendry and several others.

Keep in mind that what I am doing is NOT designed for the masses but rather for the very few.  I am trying to pick the exact top and then leverage up heavily short.  I am doing it using chart models, not "fundamental data" since the fundamentals generally lag the charts.  My risk mitigation strategy is simple: if a model goes bust then fold quickly like that annoying poker player who is no fun to play with because he only plays good hands.  The annoyance is amplified by the fact that this person usually walks away from the table with the most of other people's money and on those few times that he does lose, the losses are very small, especially compared to the other gains.

My advice for most people who know a crash is coming but don't want to play it edgy like this is simple: wait for the first big 300-500 point, high volume down day on the DJIA and then begin to short.  That will be the wake up call that tells us that the southward turn has begun.


As for interest rates, I think there are 3 general models for bottoming to choose from, red, blue and black as shown below.  I put it in the form of an ending diagonal to justify at least the possibility of the black case even if it is not my primary model right now.   Red is my primary then blue, then black.  Note: black would imply that the 10 year treasury rate collapses to just 7 or 8 tenths of a percent.  It could happen but it would be the extreme case.  If we see that then you know the game is over.  Rates cannot go below zero after all meaning the only thing to do is go up from there.  Player's will have leveraged up with falling rates if that happens and so the de-leveraging would be shockingly fast from that point.
 

For now, below is my primary model for TNX.  I think interest rates are already in a new bull market that began in June 2012.  Wave 1 up peaked at the start of the year.  Then we got a (early Feb) b (early April) and c (late May).  So I think wave 2 down of TNX finished late May.  That means that the bounce since then should be the start of wave 3 up.   A nice gap up soon would support this case.

The main reason it is primary is that the move since the start of the year looks like a 3 wave retracement back down to the prior 4th (which is right at the 38.2...).  The B wave is a clear triangle as is often the case.  It will be confirmed if we get a higher high than red 1 from here.  The result should be apparent soon enough. 

Anything higher than 28 gives a big push to the red model.  Anything below 24 strongly suggests that blue or black models are playing out. Higher interest rates = lower stock prices and lower interest rates imply higher stock prices.  Get very fearful of being long if you see falling rates and a faltering market.  That would mean that gamblers are so leveraged to the hilt that they cannot take on more debt even if it were nearly free to do so.  That would be a negative divergence for sure.  When correlation is lost, players have lost confidence in the con.

Friday, June 20, 2014

Metals and miners update.

So you played the turn in JNUG/JDST that I modeled yesterday and knocked down some green.  It is time to party without worry yet?

First off, my high level primary model for GDXJ is given below:  There is certainly a lot to like about this model and so far it has been good.  But now everyone will see the break back into the channel and will assume the gold bear has returned.  For now, we have to go with the model.  The good part about it is that we seem to have gotten an e wave throw over which very quickly broke back down into the channel.  As long as it stays in the channel we are golden but if it comes back out I would sell without hesitation for the same reason that the head fake down into the DJIA (supposed) ending diagonal was a kiss of death for the model. A real direction change will not likely include waffling above and below support.  So at we have an easily identifiable sell trigger for JDST now.


Zooming in, what is good is that it looks like a 3rd of 1 back down took out the upper rail (blue circle) and that we are now working on some kind of triangle.  This could either be a 4th wave or a B wave and it is very hard to tell at this point.

The blue path suggests that the current tiny triangle is a B wave, not a 4th wave.The blue model says today's pullback in GDXJ was just A of C which will eventually retrace to the level of the prior 4th - a healthy pull back that, when completed, will lead to higher highs.  If Monday gives us a rapid move down in GDXJ to about the level of the prior 4th I will dump JDST and strongly consider re-entering JNUG at that point because that would mean that my alternate top level model (below) is taking control.

However, if GDXJ goes down only a little bit on Monday and then does an a-b-c back up to kiss the upper rail from below before a more controlled move down then the red (my current primary model) path is in effect.  In that case, wave E of 4 has really completed and we are now in the beginning of a 5 wave decline that will comprise the 5th and final wave of a large downward impulse which started in Nov 2010 and has lasted until now.


Right now it could really go either way but we will know a lot more based on the wave action on Monday in GDXJ.


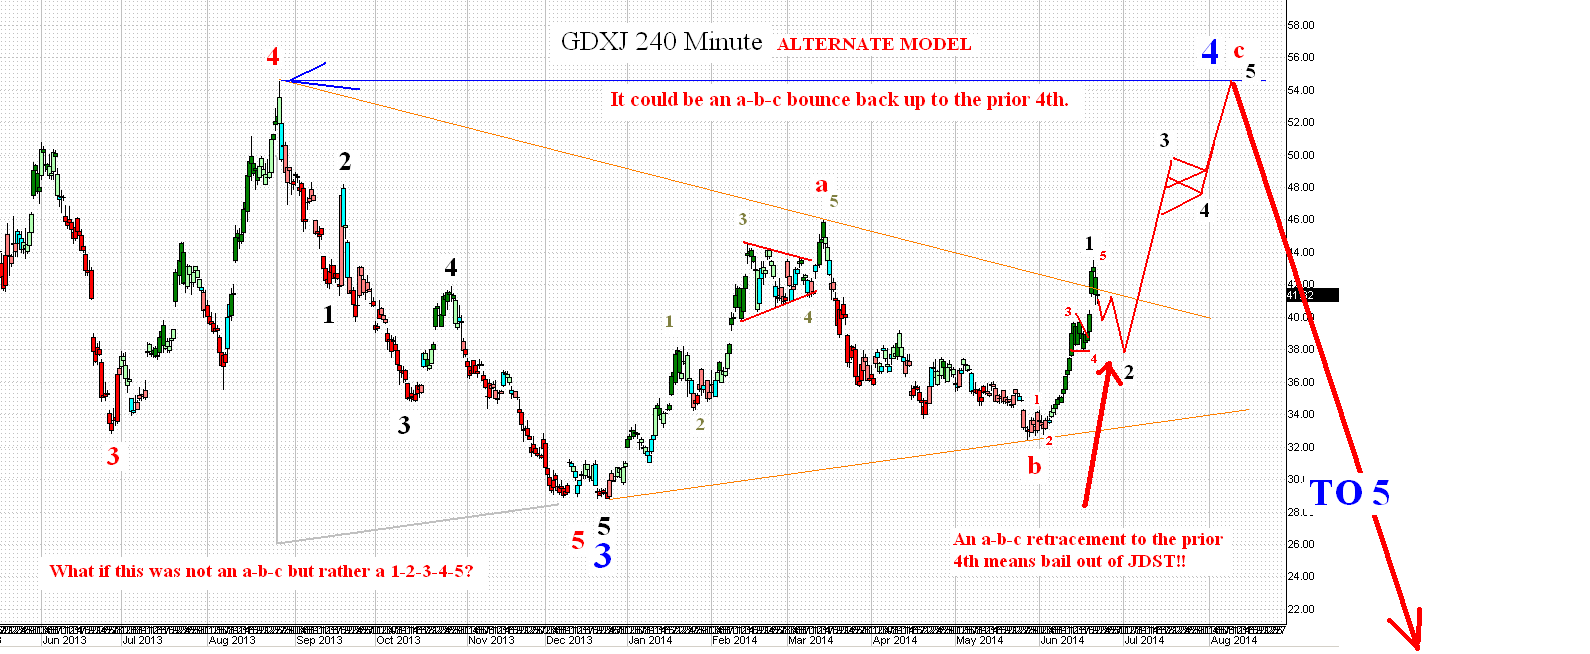
Here's that alternate top level GDXJ model I mentioned above.  SORRY, I got the color reversed in this model relative to the last one and it's too much trouble to change.  I mainly wanted to show how the 4th wave could legitimately either peter out here or alternatively rise back up to the level of the prior 4th.  I also wanted to point out that wave red A could easily be counted as a 5 wave move which would mean it is not part of a triangle. Same for 5 of 3.


At the same time also check out the model in this post which expected a pull back to that triangle (treating it as a 4th wave and not a B wave) and then compare the shape of the chart to below.  Yes, I was early in modeling the top of 5 because of the unusual power of this 5th but IF that really was 5 of just 1 then the retracement target should be the same no matter how high the 5th wave went (the level of the prior 4th).

So with all this, you can see that both models have something going for them.  Monday we will likely know!!  I personally hope to have to switch to my alternate model as a result of a massive swoon by JNUG on Monday to about $22 (which is the 50% fib).  I don't think the 38.2 fib will be low enough and the 61.8 looks too extreme.  The key is that it would happen in 5 powerful waves down because it will be a C wave.  also, the chart has to scare as many late-comers into JNUG as possible so the best way to do that is with hurtful cliff diving, taking out stops all the way down.


One more piece of evidence that suggests that the alternate is really the primary is the shape of the gold chart (below) which indicates that the E wave rally is about half way done.  The E of 4 wave should be a-b-c in nature like the others in this 4 wave.  EWI likes the GLD chart count shown below.

Do not mistake this chart for GDXJ!  They look similar but GDXJ already breached the top rail while GLD is only half way there.  In retrospect, that would be a lot of upward travel for GLD if JNUG is already headed down.  So again, I hope to switch my alternate out for my primary model on Monday but I will do it based on observed wave count and not on gut feel or speculation.  And if I have no count that I trust, CASH is the right asset class to hold!


Twitter Delicious Facebook Digg Stumbleupon Favorites More