First, here is my current model for AAPL. I see that it is in the 5th wave of an expanding wedge formation. The count does model well as an a-b-c which is what each wave of the over arching formation should look like. Additionally, the 5th wave (green 5) is now up against the green resistance line.
If this line holds and then breaks down below green 4, it is assured that the 2009 rally is over. There is no way AAPL will fall by itself.

Likewise, however, it is unlikely for markets to really crash if a speculative asset like AAPL continues to move higher. In order to avoid head-in-sand disease based on ideology and too long term of a time horizon (things that EWI was correctly diagnosed with in a link given in a recent post) we need to look at both sides of things from a chart data perspective and then use data, not gut feel or what we think should be"right" or "fair" (the market is neither...) as our guide.
So here is the flip side of the AAPL coin. It says that 5 waves up to center channel was only A of 5 and that that prominent mid channel triangle was not 4 of C but rather B of 5. While this is not currently my primary model, ignoring it only makes it more likely to occur because it is the goal of the herd to be as tricky as possible near the big turns in order to minimize the number of crocs waiting for it when the river crossing south finally does begin. The chart must begin to break down within a matter of days lest the alternate model rapidly gain strength. This is because we are either very nearly done with 5 of C of the model above OR we are nearly done with 1 of C per the model below. The recent close by the DJIA and the DJT and the $COMPX to new highs should not be ignored and, given two recent attempts to call the top which have failed, EWI could easily be underestimating how much play is left here.
I think the market reaction at the elections will tell us quite a bit. If they surge then shorts better step back and expect more unwarranted market expansion, perhaps even to AAPL 150 as shown below. Do not forget how fast the price movement can be during the end game!!! One look at the miners should be evidence enough of this. At the same time rest assured that when this rolls over it will do so with a historically significant thud. A good trigger point to watch for all of the markets is AAPL $95 which is the low point of the recent triangle. If that is broken below it will strongly suggest that the model shown above is the correct one. Conversely, a gap upwards from here for any reason suggests a rapid C wave ride to the top rail is in store and in that case it could mean $COMPX 5000.
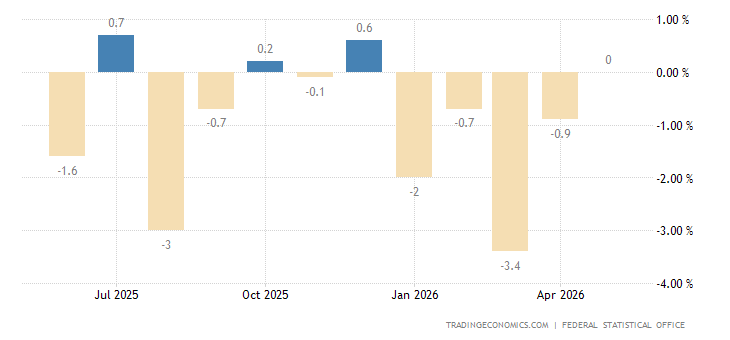
I thought that the bull was completely dead. Recent events have proven that view wrong. But there is zero doubt that the bull is terribly wounded and it is bleeding out globally. Of course a wounded bull can be the most dangerous kind so keep your eyes peeled for signs that it might have one more good charge left in it. If that happens, side step the thrust and then be ready to bring the axe down because there is no way this goes on and on when global credit has peaked. Just look at the output reports from Germany and China (major global export economies) if there is any doubt about that.


No comments:
Post a Comment