Here is a short but interesting article on how hedge funds (which are anything but hedges anymore, they are more like super leveraged longs) are closing down. Not enough opportunity anymore it seems and so the smart money is sneaking out the back door of the Ponzi markets. Again, no Ponzi plateaus. When the energy source runs out (in this case leveraged market debt which is the stock in trade of the hedge funds), the Ponzi goes into reverse.
All of this hedge fund action is happening while prices continue to trend higher on very thin volume. Open elevator shafts await the unwary going forward. Very few if any in the main stream media are talking about the declining volume of the markets but low volume means not enough buyers to catch even relatively small volume sales like happened on AAPL shares yesterday. The result is wild swings as the sellers cash in. This is why all the smart guys out there are calling for higher volatility. Thinly traded markets always make for larger spreads and higher volatility.
Tuesday, December 2, 2014


[INTC] update
Here is my previous Intel update. It allowed for at move up into the $40 range but I'm now narrowing that down based on the waves that have transpired since then. My new model is below. Bottom line is that we are in the very final few days of grinding out a top in throwover land. We might see the current action turn into a triangle and stall for another day or two before hitting $38 but the count could also be complete right here. So $40 is now off my RADAR, we are now either there already or within 80 cents of the peak according to this new model. It should be easily validate-able given the small scale it is confined to.
Keep in mind that this is the expanding wedge which is 5 of C of 5 of a larger expanding wedge shown in this previous post. When this breaks down it should be fast and furious because expanding wedges get more volatile over time (unlike a contracting horizontal triangle which reduces volatility over time into the tip).
If this plays out exactly like my model shows then I will double down on the Intel puts that I began buying here.

Keep in mind that this is the expanding wedge which is 5 of C of 5 of a larger expanding wedge shown in this previous post. When this breaks down it should be fast and furious because expanding wedges get more volatile over time (unlike a contracting horizontal triangle which reduces volatility over time into the tip).
If this plays out exactly like my model shows then I will double down on the Intel puts that I began buying here.
UVXY vs TVIX and other updates.
TVIX pull back today is 6.45 %, UVXY pullback is 7.36. So it seems that UVXY is a bit more volatile. In any case I moved out of TVIX on a stop early this AM and just bought into UVXY instead. I will be trading UVXY instead of TVIX going forward. I see today's pullback as just a bullish retracement to do a gap fill. If this is correct there should be an AM reversal back upwards:

I was also able to get back into JNUG on the pull back to 3.63 which was the 70.7 fib retracement. Stops are now at 3.60 on JNUG.
Finally, I think UUP is finally really near the peak today as it is kissing the upper rail of the channel. It could throw over up to 23.60 but it is now within my target range of 23.50-23.60. The most satisfying finish would be where height of 5 is the same as vertical height of 1 as represented by the blue bar. However, the gap fill on TVIX and UVXY is a compelling place to reverse so I wonder if UUP it will ever get that high. JNUG, UVXY seem to be trading in opposition to UUP.

I was also able to get back into JNUG on the pull back to 3.63 which was the 70.7 fib retracement. Stops are now at 3.60 on JNUG.
Finally, I think UUP is finally really near the peak today as it is kissing the upper rail of the channel. It could throw over up to 23.60 but it is now within my target range of 23.50-23.60. The most satisfying finish would be where height of 5 is the same as vertical height of 1 as represented by the blue bar. However, the gap fill on TVIX and UVXY is a compelling place to reverse so I wonder if UUP it will ever get that high. JNUG, UVXY seem to be trading in opposition to UUP.
Monday, December 1, 2014
[AAPL] flash crash or the start of something much bigger?
In my previous AAPL update I provided a model which indicated that AAPL had peaked. Here is the 3rd chart from that post which is the 30 minute view:

Here is today's update. The are calling this a flash crash. Maybe it is but it does show the amount of volatility possible. We could all wake up one day to find the markets down by 10%. If this can happen to AAPL then what stock is immune?

XOM count
Here is my previous Exxon Mobil post. We will know pretty quickly tomorrow if this count is right or not but so far this looks like 1-2-3 and 4 of a new downward movement on XOM.

More thoughts on M+M: JNUG model and trading plan.
It's likely that we were all given a great gift on Friday with the collapse of JNUG. Metals went down as well but JNUG cratered. The turns are supposed to be scary and difficult to count lest everyone and their dog get in on the fun. So here are a couple more insights as to my current JNUG model to help you realize that now is the time to go buy something golden and that no the train has not left the station without you. Not yet. In fact, the train has just entered the station and was shifting around a bit as it came to a complete stop. It was rightfully perceived as dangerous to board before now. But the doors are now wide open and now is the time to board.
Buy something golden folks.
For those who care about grubbing every penny out of the trade, below left is my current view on what is going on: The bottom in JNUG was actually put in on Nov 6th and since then it has been forming an expanding wedge wave 1 of the new bull market. There is little else that can account for this particular kind of volatility. As you know, volatility of the expanding wedge just gets higher and higher over time until the formation is complete. This model explains all of these strange 3 wave moves we have been seeing. It also explains the long horizontal triangle from Nov 19-26 and then the subsequent sell off on Friday that kissed the lower rail. Of course it will be negated by a lower low than what I have marked as red 4 but we should not have to wait that long to know if the model is good or not.
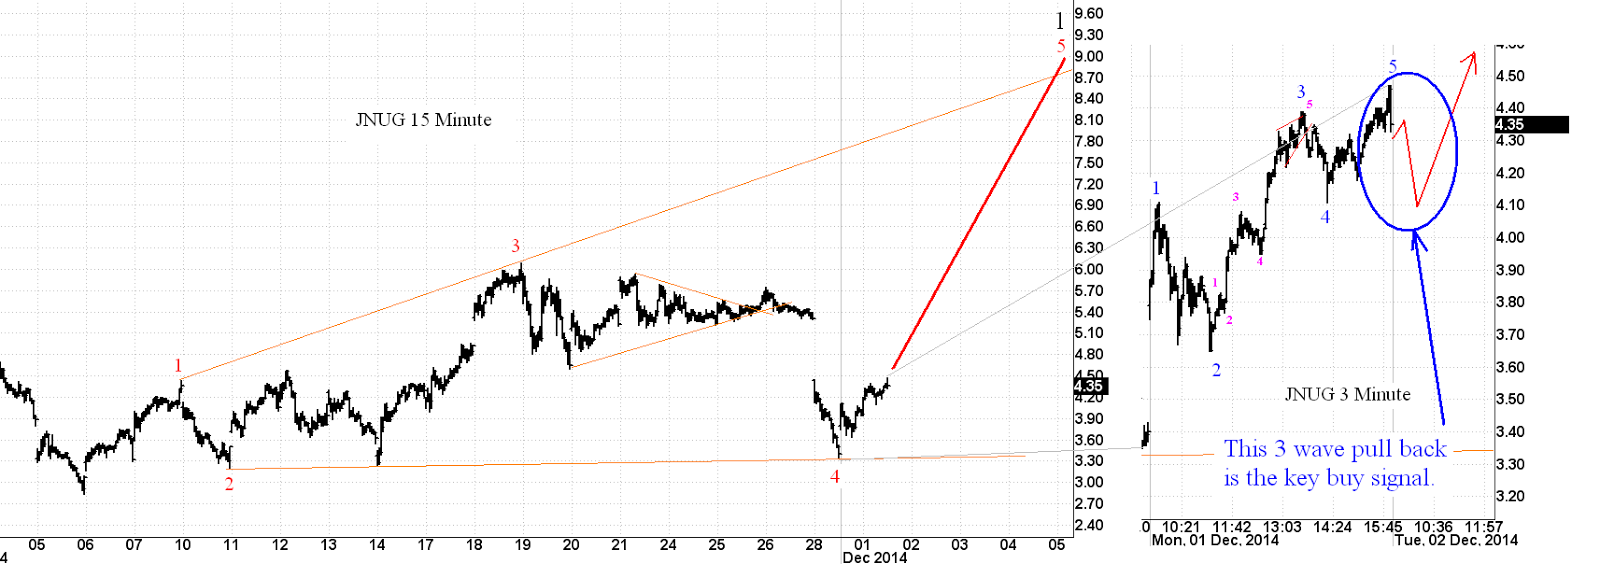
To expand upon what to look for, observe that above, right we see just today's action which was a fat 23% move at the close. I see this as a bullish wave 1 of A of 5. In other words, the move up to $9-$10 should not be a straight shot but rather an a-b-c. And since the recent B of 4 wave was a H.triangle, the next B of 5 wave should be a sharp vee.
The real tell should be tomorrow AM. If this count is right we should expect to see a 3 wave pullback to the level of the prior 4th which is at around $4.10. The 38.2% fib would be $4.05. The 50 fib would be $3.91 and the 61.8 fib $3.78. All of these are pull back targets in this mode but I suspect that, due to the need to boogie pretty quickly to the top rail, the pullback will only be to the $4 level. That part is gut feel, not supported by any model
Now, if we get a small pullback and then a higher high than ~$4.50 this is a clear and strong buy signal for people who would like to double their money over the next 5-7 trading days. Yes folks, double. That's just how quickly JNUG moves from these low levels.
If you decide to buy in tomorrow based on this model data, look to hold until you see an a-b-c to break out the top rail. That could be $9, $10 or $11. If you see that a-b-c in the form of 5-3-5 move up above the top rail then sell baby sell and let the shares come back down to you. If they hit $10, the 50% fib pull back would be $6.70. This is where you mos def want to be in the shares because that would be wave 2. Wave 3 could then scream up to $14-$15 in short order.
This is where serious money is likely to be made by those who are not afraid to trade.
Buy something golden folks.
For those who care about grubbing every penny out of the trade, below left is my current view on what is going on: The bottom in JNUG was actually put in on Nov 6th and since then it has been forming an expanding wedge wave 1 of the new bull market. There is little else that can account for this particular kind of volatility. As you know, volatility of the expanding wedge just gets higher and higher over time until the formation is complete. This model explains all of these strange 3 wave moves we have been seeing. It also explains the long horizontal triangle from Nov 19-26 and then the subsequent sell off on Friday that kissed the lower rail. Of course it will be negated by a lower low than what I have marked as red 4 but we should not have to wait that long to know if the model is good or not.
To expand upon what to look for, observe that above, right we see just today's action which was a fat 23% move at the close. I see this as a bullish wave 1 of A of 5. In other words, the move up to $9-$10 should not be a straight shot but rather an a-b-c. And since the recent B of 4 wave was a H.triangle, the next B of 5 wave should be a sharp vee.
The real tell should be tomorrow AM. If this count is right we should expect to see a 3 wave pullback to the level of the prior 4th which is at around $4.10. The 38.2% fib would be $4.05. The 50 fib would be $3.91 and the 61.8 fib $3.78. All of these are pull back targets in this mode but I suspect that, due to the need to boogie pretty quickly to the top rail, the pullback will only be to the $4 level. That part is gut feel, not supported by any model
Now, if we get a small pullback and then a higher high than ~$4.50 this is a clear and strong buy signal for people who would like to double their money over the next 5-7 trading days. Yes folks, double. That's just how quickly JNUG moves from these low levels.
If you decide to buy in tomorrow based on this model data, look to hold until you see an a-b-c to break out the top rail. That could be $9, $10 or $11. If you see that a-b-c in the form of 5-3-5 move up above the top rail then sell baby sell and let the shares come back down to you. If they hit $10, the 50% fib pull back would be $6.70. This is where you mos def want to be in the shares because that would be wave 2. Wave 3 could then scream up to $14-$15 in short order.
This is where serious money is likely to be made by those who are not afraid to trade.
Just bought more GE Jan 2016 $13 puts.
They filled the order @ $0.11. I am tempted to buy more of these given the low price but I have to be disciplined so I limited myself to adding another 100 contracts.
This low price represents faith that nothing, and I mean nothing whatsoever at all, can go wrong between now and 2016. That is more than a year from now and someone is selling these at 11 cents. GE doesn't have to go down to $13 for me to make out like a bandit here. These will easily double or triple at the first smell of any global credit trouble.
All I can say is this is an asymmetrical bet that has very, very high odds of paying off big time.
This low price represents faith that nothing, and I mean nothing whatsoever at all, can go wrong between now and 2016. That is more than a year from now and someone is selling these at 11 cents. GE doesn't have to go down to $13 for me to make out like a bandit here. These will easily double or triple at the first smell of any global credit trouble.
All I can say is this is an asymmetrical bet that has very, very high odds of paying off big time.
Subscribe to:
Posts (Atom)