Monday, December 1, 2014
DJIA probably moving into a 3rd wave down.
Don't be surprised to see heavy selling into the close. After all, last one out of a Ponzi scheme is left holding an empty bag and the criminals running Wall St. know it. They have fleeced everyone that was left to be fleeced and now the ocean of stocks is only filled with sharks and no victims. Thus, the sharks will now turn on each other and the ridiculous hot air built into these Ponzi markets will be let out. My 2017 target is still deep sub 5k and would not surprise me at all to find it much lower. Stocks are essentially worthless, just like the dollar and all other paper assets. They will all eventually trade at their inherent worth.


General Electric update
I wanted to update this recent GE post. As you can see from the chart below, today GE came down and kissed the $25.80 level that I indicated would be a key level in determining if the chart was going to treat the current price level as a short stroke 5th or whether this is just 1 of 5.
The jury is still out but the nature of the pullback so far looks motive and not corrective. If GE can't move back up into that gap today then the risk of an opening tomorrow with a big gap down that takes out both the upper and lower rails of the triangle (i.e. to $25 or less) in one fell swoop becomes much higher. If that happens, the 5th wave is confirmed to be over.
 If that happens, I don't give the markets much hope at all. The 2009 peak will very likely be in and all that will await us is the crash.
The big AAPL move down today on really, really pathetic volume should be a massive warning shot to anyone paying attention on how thinly traded these markets are. With a market cap of 600+ billion, that swing was good for 50-60 billion in paper "wealth". I can tell you right now, that wealth never existed in anything but the minds of Mark and Patsy. The whole thing is obvious and laughable. They think they have wealth because it says so on some paper. So did Madoff's clients (also named Mark and Patsy). It will end the same way. The US government is a Ponzi scheme operator's idea of a Ponzi scheme! All of the markets are.
The jury is still out but the nature of the pullback so far looks motive and not corrective. If GE can't move back up into that gap today then the risk of an opening tomorrow with a big gap down that takes out both the upper and lower rails of the triangle (i.e. to $25 or less) in one fell swoop becomes much higher. If that happens, the 5th wave is confirmed to be over.
If that happens, I don't give the markets much hope at all. The 2009 peak will very likely be in and all that will await us is the crash. The big AAPL move down today on really, really pathetic volume should be a massive warning shot to anyone paying attention on how thinly traded these markets are. With a market cap of 600+ billion, that swing was good for 50-60 billion in paper "wealth". I can tell you right now, that wealth never existed in anything but the minds of Mark and Patsy. The whole thing is obvious and laughable. They think they have wealth because it says so on some paper. So did Madoff's clients (also named Mark and Patsy). It will end the same way. The US government is a Ponzi scheme operator's idea of a Ponzi scheme! All of the markets are.
Look at how fragile these share prices are! AAPL shares experiencing high volatility.
Anyone who thinks that stock market cap is something other than a vaporous con needs to have a smell of AAPL shares today because that one has a stinky diaper. Last week's model of AAPL shares predicted they would begin to sell off this week and so they have. The shares began selling off at the open and before anyone knew it, they had plunged $8 per share before catching a thin bid. It's like I have written so many times, the declining volume here means that the pumped up prices didn't really add masses of the public like the Ponzi pushers hoped for. It did drive all the shorts out though. So now the public doesn't want to buy and the shorts don't have to cover.
The only players left in the market now are leveraged longs. Mark and Patsy are out of the game now and so it is just the criminal element working against itself. This is why when the trap door opens it will be a fast and furious decline that nobody will have seen coming because nobody really understands the true nature of what is going on. It is a Ponzi scheme and they always fail. When they fail it does not happen gradually because the participants all go running for the door at the same time and the last guy out gets left holding an empty bag.
I'm telling you, that kind of plunge on low volume is a bad, bad sign. The next bad sign will be when we see a big gap down in the shares and volume skyrockets indicating that the con men are no longer colluding with each other but instead have decided that it needs to be every man for himself.
Just like the collapse of any other organized crime syndicate that ever existed...

The only players left in the market now are leveraged longs. Mark and Patsy are out of the game now and so it is just the criminal element working against itself. This is why when the trap door opens it will be a fast and furious decline that nobody will have seen coming because nobody really understands the true nature of what is going on. It is a Ponzi scheme and they always fail. When they fail it does not happen gradually because the participants all go running for the door at the same time and the last guy out gets left holding an empty bag.
I'm telling you, that kind of plunge on low volume is a bad, bad sign. The next bad sign will be when we see a big gap down in the shares and volume skyrockets indicating that the con men are no longer colluding with each other but instead have decided that it needs to be every man for himself.
Just like the collapse of any other organized crime syndicate that ever existed...
JNUG update
We are now about to see what is really what with JNUG. In this post I predicted a major inflection point was upon us and man was I right about that. It resolved in the direction of Avi's position. After a 36% drubbing last Friday, we are seeing a 20+% move up today. But the move has an a-b-c vibe to it so JNUGgers need to show great caution here. I recommend using a 5% training stop. If this does not stop in the 38.2 fib or 50 fib range then it could take off to a higher high from here.
But so far, the chart looks like a correction of the motive wave down on Friday and the red path is my primary count for now. IF this can turn into 5 waves up then I could change my count quickly on this but for now I'm still under the view that Avi's count will prevail.
All of this of course is mainly just trying to grub the last dollar out of a very volatile situation. Smart traders who cannot watch the chart each day will dollar cost average into something(s) golden over the next month.

But so far, the chart looks like a correction of the motive wave down on Friday and the red path is my primary count for now. IF this can turn into 5 waves up then I could change my count quickly on this but for now I'm still under the view that Avi's count will prevail.
All of this of course is mainly just trying to grub the last dollar out of a very volatile situation. Smart traders who cannot watch the chart each day will dollar cost average into something(s) golden over the next month.
Steen Jakobsen, Saxo Bank: "One Guaranteed View: Volatility will go up significantly"
Steen Jakobsen, the chief economist for Saxo Bank, is frequently quoted by Mish. The latest installment is here. As a TVIX long, the part of it that I am most interested in is this:
 In any case, if we see this then we have to expect a big a-b-c pullback to the 38.2, the 50 or the 61.8% fib. I would not ride it back down! I would bail out while it is in throw over territory and then look for those 3 waves back down. In an extreme case, the level of the prior 4th could be hit which is about 11, so as you can see, during this market roll over phase (which is taking months to play out), buy and hold of TVIX can be a frustrating affair. But once wave 3 up begins then buy and hold will become a much better strategy for most people until wave 3 is over.

Simple Man's View
Out of those bullets, the last one is most important to me: volatility will increase no matter what. Steen thinks so. Mohamed El-Erian (ex CEO of PIMCO) thinks clearly thinks so as you can gather from the recent article entitled "El-Erian: October volatility is a preview of what's ahead".
- One Trading View: Fixed income will outperform all assets. US 10-Year treasury yield will drop under 1.5% by 2015 Q3
- One Economic View: Disinflation/deflation will be catalyst for asset sell-off
- One Timing View: Q2/Q3-2015 low this cycle for all indicators
- One Guaranteed View: Volatility will go up significantly
Out of those bullets, the last one is most important to me: volatility will increase no matter what. Steen thinks so. Mohamed El-Erian (ex CEO of PIMCO) thinks clearly thinks so as you can gather from the recent article entitled "El-Erian: October volatility is a preview of what's ahead".
Gee folks, what happened in October? Oh, that's right, the VIX and all VIX derivatives skyrocketed. Below is the actual volatility index. If my wave count is correct, I think what we are looking at here is a large first wave up forming which started in July. This first wave up is in the form of an expanding wedge which will likely throw over the 5th wave as shown. The normal amount of throw over for this kind of move would take the VIX to around 44. Won't it be interesting if that's where it ends up?
In any case, if we see this then we have to expect a big a-b-c pullback to the 38.2, the 50 or the 61.8% fib. I would not ride it back down! I would bail out while it is in throw over territory and then look for those 3 waves back down. In an extreme case, the level of the prior 4th could be hit which is about 11, so as you can see, during this market roll over phase (which is taking months to play out), buy and hold of TVIX can be a frustrating affair. But once wave 3 up begins then buy and hold will become a much better strategy for most people until wave 3 is over.
OK that's the actual VIX which you cannot trade. TVIX, which I am trading for now (but am considering a swap to UVXY because of a recent comment by reader "TJ"), is below. My target price for this wave is $8.80 in the 5th wave throw over. Pay no attention to the fact that 88 is double 44 or that the low was 2.20 which is half of 4.40. If this occurs it will all be simple coincidence....
In any case, the pullback will likely be red, green or blue corresponding to 38.2, 50 and 61.8% fib. Again, the wild card would be a lovely trip all the way back to the bottom which, for anyone who bailed during the throw over, will simply get to double dip on the coming 3 bagger.
Looking for signs that the next big DJIA selloff is beginning.
The holiday season typically has a bullish bias with names like "Santa Rally", etc. But the wave count really looks peaky at this point on many fronts and so I am on crash watch. I think that if we can put in 5 waves down into black 1 as shown below that the selling will likely accelerate into black 3 after a mid morning sucker's bounce. Once the selling starts, the leveraged longs (who are really the bad guys in this deal because they are using leverage to pump everything up including housing prices, etc.) will start getting their margin calls. Either the Bernanke put is dead and markets must live or die on their own dime or the pitchfork revolution is not far off.
Which one is it going to be, Yellen? My money is literally betting on her trying to do some sort of controlled asset price correction. But Yellen is going to get trampled by the herd once the selling momentum picks up speed. Once everyone runs for the door, nobody will be listening to her useless ass.

Which one is it going to be, Yellen? My money is literally betting on her trying to do some sort of controlled asset price correction. But Yellen is going to get trampled by the herd once the selling momentum picks up speed. Once everyone runs for the door, nobody will be listening to her useless ass.
Oil: the bigger picture.
Unfortunately, no single charting tool is worth much of a crap. Either the resolution sucks or there is not enough historical data available to discern the larger wave count. So I have to try to make sense from multiple sources. After reviewing the data we have, it seems that the oil spike into 2008 was a 5 wave deal. The count is so clear, including parallelism and alternation, that I won't insult you by annotating it as if you need that help. Thus, everything since then seems to have been corrective in nature. But it was such a massive spike that the correction has to be equally as massive.
For people that might be bewildered by this, this massive volatility has nothing to do with refinery capacity, new oil discovery or production or anything else of the sort. It has to do with the world trying to figure out what the petrodollar is still worth. That is a daunting task because in fact the paper money is worthless even though most people do not understand this basic economic fact. They are fooled by the fact that people still accept the paper in return for their goods and services. Still since the whole world runs on fake money, the real question becomes relative: is my fake money better than your fake money?
Rest assured that at some point in the not distant future, all of the fake money will be worth nearly nothing as the world goes through a global economic reset and fiat currency is rejected in a rapid chain reaction by all nations. Yes, it's a crazy sounding claim but the fact is that the US is running a debt Ponzi based on the USD and Ponzi schemes always collapse eventually. Since all other paper fake money is tied to the dollar and since nobody wants their fake money to appreciate in value lest the savers who hold it actually get a fair shake, once the USD goes down, it all goes down. We are the linchpin in the pyramid shaped house of cards.
In any case wave A of the correction happened in early 2009 and since then we have been tracing out the B wave. The C wave seems to have begun in mid 2014 and is picking up speed right now.
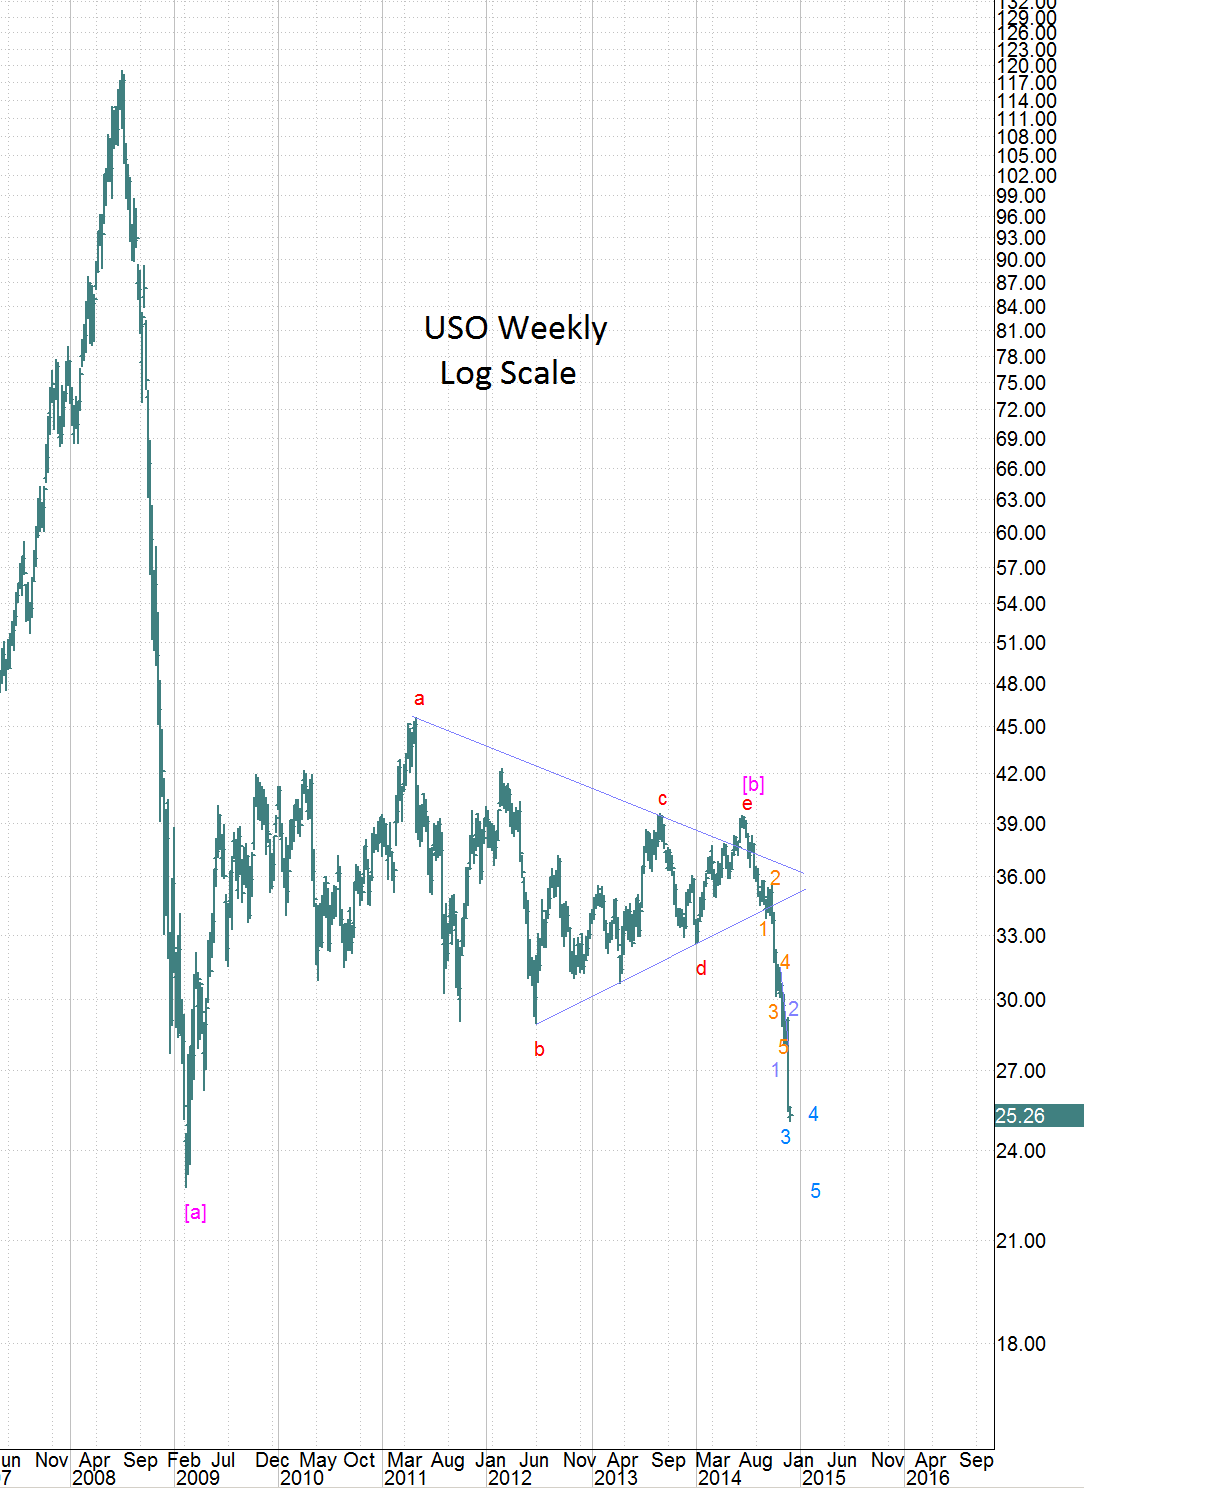
At the lower level it is always difficult to know the exact wave count so below are my top two counts. The primary DUG count (remember: inverse of USO above) is on the left and it says that mid 2014 was the low and that since then we have wave 1 up, 2 back down and are now working on 3 up.
The alternate count on the right says that the recent DUG bounce to ~$60 was an a-b-c and that it came back up to the level of the prior 4th. Thus it was some kind of correction, probably blue 4 as shown and now we get one more spike in oil which equates to one more drop in DUG before the real correction upwards begins. If you are playing this, a DUG high above the recent high of around $58.80 means that the alternate count cannot be correct.

Time will tell how it actually plays out but all of this massive global volatility is not healthy and it is not a sign of of a healthy global economic system. I want to stress here that it is not the economy that is bad; it is the system itself which is bad and corrupted and which cannot continue in the same form as it exists today for very much longer.

For people that might be bewildered by this, this massive volatility has nothing to do with refinery capacity, new oil discovery or production or anything else of the sort. It has to do with the world trying to figure out what the petrodollar is still worth. That is a daunting task because in fact the paper money is worthless even though most people do not understand this basic economic fact. They are fooled by the fact that people still accept the paper in return for their goods and services. Still since the whole world runs on fake money, the real question becomes relative: is my fake money better than your fake money?
Rest assured that at some point in the not distant future, all of the fake money will be worth nearly nothing as the world goes through a global economic reset and fiat currency is rejected in a rapid chain reaction by all nations. Yes, it's a crazy sounding claim but the fact is that the US is running a debt Ponzi based on the USD and Ponzi schemes always collapse eventually. Since all other paper fake money is tied to the dollar and since nobody wants their fake money to appreciate in value lest the savers who hold it actually get a fair shake, once the USD goes down, it all goes down. We are the linchpin in the pyramid shaped house of cards.
In any case wave A of the correction happened in early 2009 and since then we have been tracing out the B wave. The C wave seems to have begun in mid 2014 and is picking up speed right now.
At the lower level it is always difficult to know the exact wave count so below are my top two counts. The primary DUG count (remember: inverse of USO above) is on the left and it says that mid 2014 was the low and that since then we have wave 1 up, 2 back down and are now working on 3 up.
The alternate count on the right says that the recent DUG bounce to ~$60 was an a-b-c and that it came back up to the level of the prior 4th. Thus it was some kind of correction, probably blue 4 as shown and now we get one more spike in oil which equates to one more drop in DUG before the real correction upwards begins. If you are playing this, a DUG high above the recent high of around $58.80 means that the alternate count cannot be correct.
Time will tell how it actually plays out but all of this massive global volatility is not healthy and it is not a sign of of a healthy global economic system. I want to stress here that it is not the economy that is bad; it is the system itself which is bad and corrupted and which cannot continue in the same form as it exists today for very much longer.
Subscribe to:
Posts (Atom)