Saturday, August 10, 2013

Netflix at important technical juncture

I won't belabor the point: the Netflix chart looks like a perfect setup for shorts.  A textbook ending diagonal has formed (but not yet been confirmed).  IF it is confirmed (by breaking down below the lower support line, and then rising into a failed test of that support line from below), NFLX shares could be in for a huge pounding.  I think it is going to happen but of course I would wait for confirmation of the breakdown before betting anything on it.

From a fundamentals perspective, Netflix shares are a huge speculative bubble.  Again, I won't spend more time here detailing it but reverse PE is 314, forward PE is 76, price/book is 13 and change and price/sales is 3.75.  These numbers all remind me of dot bomb valuations.

The NFLX chart is very worrisome, or it should be to anyone who spends any time looking at charts.  It doesn't mean it has to collapse but it does mean the odds favor that outcome big time.  But again, this is not confirmed until the lower trend line breaks down (which could be as soon as next week from the look of things).

MSFT declining double top might have just formed....

Not trying to spook anyone but IMO MSFT just finished an ending diagonal which has now resulted in a declining double top.  It then broke back into the channel of the diagonal (confirmation #1).  Confirmation #2 would be to break below the lower channel line.  With Windows 8 such a Vista-like flop it would not surprise me to see investors lose confidence in Microsoft.  I don't hope to see it but I think we will anyway.  And if the chart falls below the lower support line of the diagonal, I will be 90+ percent sure that a big crash is coming to the shares.
 

Netflix looking very toppy.


Forget all of the hype and metrics for a minute and just look at the chart below.  Netflix is quite possibly (although not confirmed by any means) to have just finished an ending diagonal which sported a failed 5th wave.   If this is the case then the stock will have formed a declining double top of incredible magnitude. 

The confirmation of this will be if the chart now breaks below the lower support line of the diagonal, especially if done on high volume and with gusto.  The denial of this outcome will likely be a break out of the upper channel which does not then quickly break back down into the channel.

All I can say is that anyone long NFLX better buy puts if the lower green channel line is broken and I personally believe that this is what will happen.

Friday, August 9, 2013

Potential technical double whammy forming

I found an interesting chart online that overlays corporate profits and the S+P 500 stock index chart.  The combination of them is a huge potential red flag to equity traders (and the computers that automatically do their bidding).  Check it out below.

Green is the S+P 500.  It is clearly a mania and very likely forming either a head and shoulders topping formation or (just as likely) an expanding triangle (which some refer to as a wizard's sleeve).  In the case of the former, the target price for the index (should a H+S breakdown be confirmed) is so low that I won't even bother writing it down.  In the case of the expanding triangle, 850 is about the right level.

What might drive such a rapid pullback is a drastic reduction in corporate profits (white chart) and the S+P 500 profits chart currently appears to be working on a 5th wave which is about the same size as its first wave.  In other words, corporate profits might be very near a 25 year peak.  If this turns out to be the case, an A-B-C retracement would be expected which would retrace to the level of the prior 4th.  That would imply a profit reduction to the level of 1996.

At some point I have little doubt that the S+P and DOW charts will both expose themselves to be manias just like the Japanese Nikkei 225 chart did over the past 30 years.  You really can't fool all of the people all of the time.

Wednesday, August 7, 2013

GLD likely tracing out 5th of C, bottom in sight

I've posted many times over the past months that gold has been in a normal bull market Elliott wave A-B-C retracement (pull back) for some time now (yes, bull markets do have pull backs!).  As a result of these declining prices, many people have been thinking it is a bear market.  I do not think this has been the case.  In my experience, nothing goes straight up or straight down.  The Elliott wave principle is very clear on the matter: after 5 waves in the primary direction, the market pulls back in a 3 wave retracement.

In any case, many people find it difficult to sit through the ups and downs and so foolish people are again calling gold "risky".  These would be the same people who think the dollar is safe and that stocks and bonds are a good value.  So it will be interesting to see how they react if GLD's price continues following my EW model.

Take a second to review the model prediction in my last post.   Now, compare that with today's chart (below).  To be sure, the model is being followed quite closely by reality.  What's cool (at least to me) is that the prior chart was still in an uptrend when I put out my last post calling for one more down wave and within a couple days of that post the chart indeed broke down.

So, here are the things I am looking at right now on the chart:
  • I think this is the C wave playing out and so the predicted blue wave down is 5th of C.  The model is predicting a bottom for gold sometime within August 2013.
  • The 3rd wave was extended and so the 5th wave will likely not be.  In fact, I expect the 5th wave to be the same approximate size as the 1st wave.  Given this, I expect wave blue 5 to bottom out mid channel thus forming a failed 5th wave and a very bullish inclining double bottom (see red line).
  • The 4th wave was a re-test of the 38.2 fib from below and it was rejected as expected.  The market has to give the price tree one final shake to see if any more sellers can be made to fall out of it at the bottom.
  • If the chart does bottom as modeled, the confirmation of the major trend change will likely come in the form of a break out of the top of the channel (green line).  Once the down trend is broken I believe that buyers will come running back in en masse. 
  • If the chart breaks out as expected, it will likely be forming a 3rd wave up.  3rd waves are never the shortest so it suggests that the 3rd wave will outperform the first wave which ran from $40 to $185.
From a fundamental perspective, gold miners are shutting down capacity all over the world right now because only their best mines have production cost structures that make it economical to mine gold at "only" $1200-$1300/OZT.  Most of their mines are not rich enough in deposits in order to be profitable at today's gold prices.  In addition, gold workers (miners) are demanding (and receiving) more pay for their labor as inflation in their food prices makes it harder to scratch out a living in the labor intensive gold mining regions of Africa.  Rising wages play havoc on production costs.

Right now, the odds strongly favor a bit more to the downside for GLD followed by a really big, eye opening rally which IMVHO will see corporations begin to keep gold on their balance sheets as an asset right along with cash and securities.  Nobody in the financial media is predicting this and I think it is going to catch a lot of people by surprise.  In fact, I think it will be the remonification of gold that is likely to be the central driver of GLD's coming 3rd wave breakout.  I expect that part and parcel of this will be the exposure of government's gold suppression efforts which today are considered as nothing more than conspiracy theories by most people.  3rd waves are often accompanied by big paradigm changes and I expect GLD's 3rd wave to be a doozy.

Monday, July 29, 2013

Intelligeddon update

In this post I conjectured that Intel shares were going to turn down based on nothing but its chart pattern.  Go back and look at the chart prediction I provided in that post and then compare it to the real time chart below.  The correllation is quite high.  The stuff in the blue box is what happen since my last post on this stock.  In the predictive portion of my Elliott wave model from that post I simply aimed hard down (red line) but of course I meant that it should go down in 5 waves (nothing goes straight up or straight down).  I've changed the red line below from a straight line to the familiar EW motive pattern just to make it more clear.


In the chart above, I currently model red 1 and red 2 as being complete and now the shares are working on red 3.  In fact, within red 3 I am modeling black 1 and 2 as being played out.  If this is a correct modeling then I expect a black 3rd wave down to occur that will likely include a large gap since it is a 3rd of a 3rd (black 3 of red 3).  And this whole wave that is happening right now is itself a larger degree 3rd wave.  So I see a 3rd of a 3rd of a 3rd happening real soon now and it promises to be a doozy (and thus the title of these two posts: Intelligeddon).

Look how red 2 retraced to the level of the prior 4th wave (wave 4 of red 1).  Look how the chart is requiring nested 3rd waves to break down the 38.2 fib.  Again, since this is all happening within a 3rd wave, the Elliott wave aspects of it will likely be quite easily noted.  December 20 puts will likely pay off handsomely for gamblers.  If INTC shares break below $19 then I foresee dire things for the stock.  If Intel goes down, it will likely not collapse in a vacuum.  It will likely be part of a much larger market collapse that includes IBM and other big names.

What will be interesting if this plays out is what happens to gold and silver.  I suspect they will be sucked down at first as if they were commodities but then they will likely bounce as shares keep falling because they will finally begin to be treated as a cash type of safe haven.  Lots of conjecture here for sure.  I hope people are enjoying the free financial entertainment.


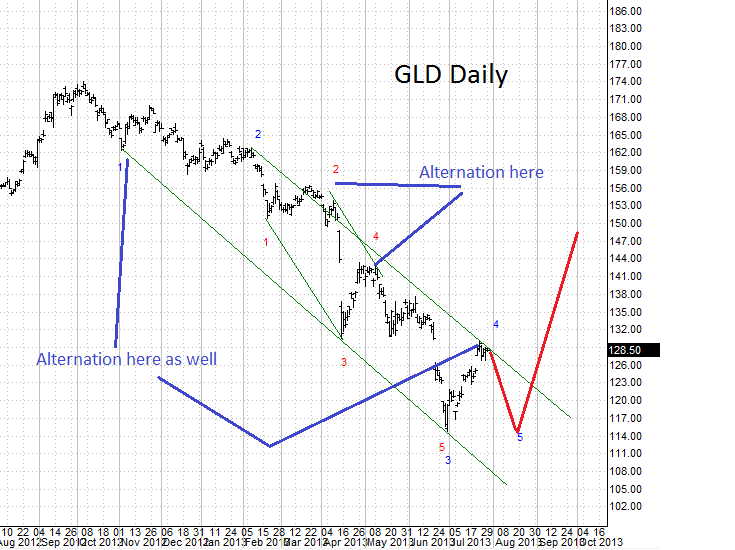
GLD Wave count suggests one final pullback

In this post I show that GLD broke below the 38.2 fib and is now testing it from below.  While I pointed out that this was an important technical juncture as well as the two ways it could go, I did not render a strong opinion on which way it would likely go.  In today's post I want to show my wave count for gold which suggests that the resistance will hold and that GLD will likely take one more wave down (along with silver IMO) before the bottom of this 2 year bull market retracement is in.

In short, the GLD count is likely to be very similar to the SLV count and so that is how I modeled it below.  The model does have a lot of Elliott wave fundamental backing including alternation shown at 2 levels.  While Prechter never specifically states it, I have found that EW principles are more easily discerned in C waves/3rd waves (the current wave downward is a C wave IMO).  Thus, we see features like alternation and 3rd of 3rd cliff diving show up very prominently.

In any case, GLD is not only trying to break back up through the 38.2 fib shown in the last post, it is also up against the top channel trend line in the Elliott wave sequence.   Thus I think the odds strongly favor one more leg down to try to retest the recent 3rd wave lows.  Note that wave blue 1 down is not very long and that wave 5 should be the same length as wave 1 if wave 3 is the extended wave in the series (and it clearly is).  So the 5th wave down is not expected to break below $110 IMO.  If this scenario plays out as my model suggests then this will form a double bottom or more likely an inclining double bottom.  A subsequent break out of the channel and then possibly a back test of it from above will likely signify that the GLD pullback is done.  The current modeling suggests the bottom will be sometime in Aug or Sept 2013.


Some fundamentals that are happening also support a bottoming move in metals.  First, on hand metals stocks are very low (historic lows) as owners of the metals have been drawing it down from the metals exchanges even as the price has been falling.  So the price smash down has not been working as expected.  The fractional reserve gold system is in trouble.  The other fundamental change is that Bernanke is escaping the Fed and Janet Yellen will likely be picked to replace him.  Yellen is a Keynesian "dove" meaning she wants more inflation.  Obama is on record that he is looking for someone to continue greasing the economic wheels. 

In short, Yellen is very close to being a puppet Fed Chairman for the government.  This means that she will be most likely be announcing new stimulus measures, increasing the fed's balance sheet and generally debasing the dollar at a significantly increased rate as compared to Bernanke.  I expect a lot of turmoil to be coming from the other Fed Presidents as they watch her destroy the dollar.  I think Yellen will be compared to Japan's Abe BOJ pick who is clearly nothing more than a puppet leader for the bank of Japan.  These things will mark the end of the pullback in metals and might also mark the beginning of significant inflation here in the US.  Time will tell but metals holders will not be disappointed IMO.
Twitter Delicious Facebook Digg Stumbleupon Favorites More